CAST: Authoring Data-Driven Chart Animations
(Proceedings of SIGCHI 2021)
Tong Ge1
Bongshin Lee
2
Yunhai Wang
1
1Shandong University
2Microsoft Research

Figure 1 : CAST enables the interactive construction of a variety of chart animations. Its interface consists of four panels: (a) data panel; (b) chart panel; (c) animation preview panel; and (d) animation specification panel. In this case, the system is about halfway through the animation of a \textit{`bump chart,'} showing how the ranking of carbon dioxide emissions has changed over the years. Please visit the CAST website (https://chartanimation.github.io/cast) to see the animation.
Abstract:
We present CAST, an authoring tool that enables the interactive creation of chart animations. It introduces the visual specification of chart animations consisting of keyframes that can be played sequentially or simultaneously, and animation parameters (e.g., duration, delay). Building on Canis, a declarative chart animation grammar that leverages data-enriched SVG charts, CAST supports auto-completion for constructing both keyframes and keyframe sequences. It also enables users to refine the animation specification (e.g., aligning keyframes across tracks to play them together, adjusting delay) with direct manipulation and other parameters for animation effects (e.g., animation type, easing function) using a control panel. In addition to describing how CAST infers recommendations for auto-completion, we present a gallery of examples to demonstrate the expressiveness of CAST and a user study to verify its learnability and usability. Finally, we discuss the limitations and potentials of CAST as well as directions for future research.
Project Page:
Paper:
[pdf] (CHI 2021)
Visual Specification
Figure 2 : The visual representation of the animation of a map showing the polio incidence rates of the United States in 1952. The title fades in first, then all dots animate according to their rate in an ascending order with the "circle" effect. Such animation is represented by two keyframe groups with other animation properties including timing bars indicating duration and delay, and iconic representation of effect type and easing function (all effect types and easing functions are listed at the top left).
Keyframe and Keyframe group. Each keyframe contains a colelction of marks to be animated along with those whose animations have been completed. These keyframes can be grouped or nested, and the level of each group is indicated using the nested boxes with different shading intensities.
Timing: Alignment, Duration, and Delay. The relative timing between keyframes is determined by three attributes: position, duration, and delay in the storyboard-incorporated timeline. The horizontal placement of keyframes determines the order of their animations. Meanwhile, CAST conveys the timing properties of each keyframe—durationand delay–using timing bars.
Animation Effects. We use icons to represent two properties ofanimation effects—effect type and easing function—as they are categorical variables. CAST currently provides eight types of effects(e.g., fade, wipe) and four types of easing drawn from commonly used tools like PowerPoint.
Interaction Mechanisms
Figure 3 : An example illustrating the keyframe and keyframe sequence construction procedure. (a) a mark unit with four blue dots is dragged over the dropzone ahead of the keyframe group containing all dots; (b) after creating a keyframe for the selected dots, a list of possible next keyframes is suggested to let users select to complete the keyframe sequence; (c) dragging one keyframe to make keyframes animate a short time after the previous one started; (d) rearranging the animation order of sibling keyframe groups; (e) selecting effect type for keyframe group; and (f) two ways to update the duration length.
Mark Unit Recommendation
Figure 4 : CAST suggests additional marks to be selected based on the user selected marks from (a) the input chart. When (b) two cells with only blue dots are selected, all blue dots in every cell are highlighted as (c) the suggestion result. When (d) two different colored dots from two different cells are selected, from (e, f) the two candidates our system recommends the (f) second candidate based on the effectiveness ranking.
Next Keyframe Recommendation
Figure 5 : CAST computes possible keyframe sequences by analyzing the visually encoded data attributes associated with the selected mark unit. (a) the selected mark unit (top) and all mark units (bottom); (b, c, d) three out of eight possible keyframe sequences generated by grouping all mark units with different permutations of data attributes, where (d) is generated with two attributes after removing \texttt{IsEdible} which is encoded by a less effective visual channel, color. The highlighted keyframes in (b, c, d) are the keyframes to be suggested to the users (after deduplication).
Example Gallery
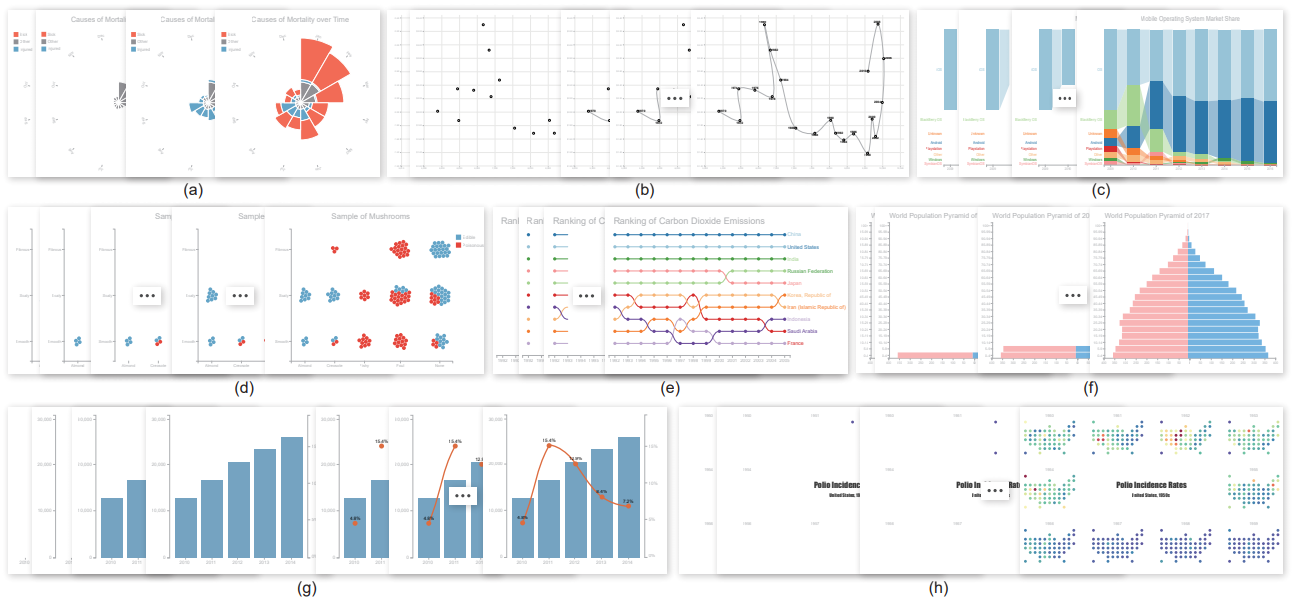
Figure 6 : Eight example chart animations demonstrating the expressiveness of CAST. We used the first seven chart animations (a-g) as tasks in our user study in Section~\ref{sec:evaluation}. In addition to these, more examples can be found with the input charts, descriptions, and videos illustrating the creation processes in the website (https://chartanimation.github.io/cast).
Acknowledgements
This work was supported in part by the grants of the NSFC (61772315, 61861136012), the Open Project Program of State Key Laboratory of Virtual Reality Technology and Systems, Beihang University (No.VRLAB2020C08), and the CAS grant (GJHZ1862).