Curve Complexity Heuristic KD-trees for Neighborhood-based Exploration of 3D Curves
Yucheng Lu, Luyu Cheng, Tobias Isenberg, Chi-Wing Fu, Guoning Chen, Hui Liu, Oliver Deussen, Yunhai WangFigure 1: Neighborhood-based exploration of 3D line data. (a) Selecting nearest lines with a radius r around two query points (white boxes in (a)). For the top query point, the nearest lines are shown in blue, for the bottom query point in green. Lines in violet are close to both query points; (b) varying opacity for the line segments is specified by using a measure based on the nearest line segments as importance. This allows us to better display large-scale vortex structures than a measure based only on local curvature, as shown in (c); and (d) abstraction of DTI fiber tracts at the scale of 5mm based on our neighborhood search, only major paths are shown.
Paper: [pdf]
Abstract
We introduce the curve complexity heuristic (CCH), a KD-tree construction strategy for 3D curves, which enables interactive exploration of neighborhoods in dense and large line datasets. It can be applied to searches of k-nearest curves (KNC) as well as radius-nearest curves (RNC). The CCH KD-tree construction consists of two steps: (i) 3D curve decomposition that takes into account curve complexity and (ii) KD-tree construction, which involves a novel splitting and early termination strategy. The obtained KD-tree allows us to improve the speed of existing neighborhood search approaches by at least an order of magnitude (i. e., 28× for KNC and 12× for RNC with 98% accuracy) by considering local curve complexity. We validate this performance with a quantitative evaluation of the quality of search results and computation time. Also, we demonstrate the usefulness of our approach for supporting various applications such as interactive line queries, line opacity optimization, and line abstraction.
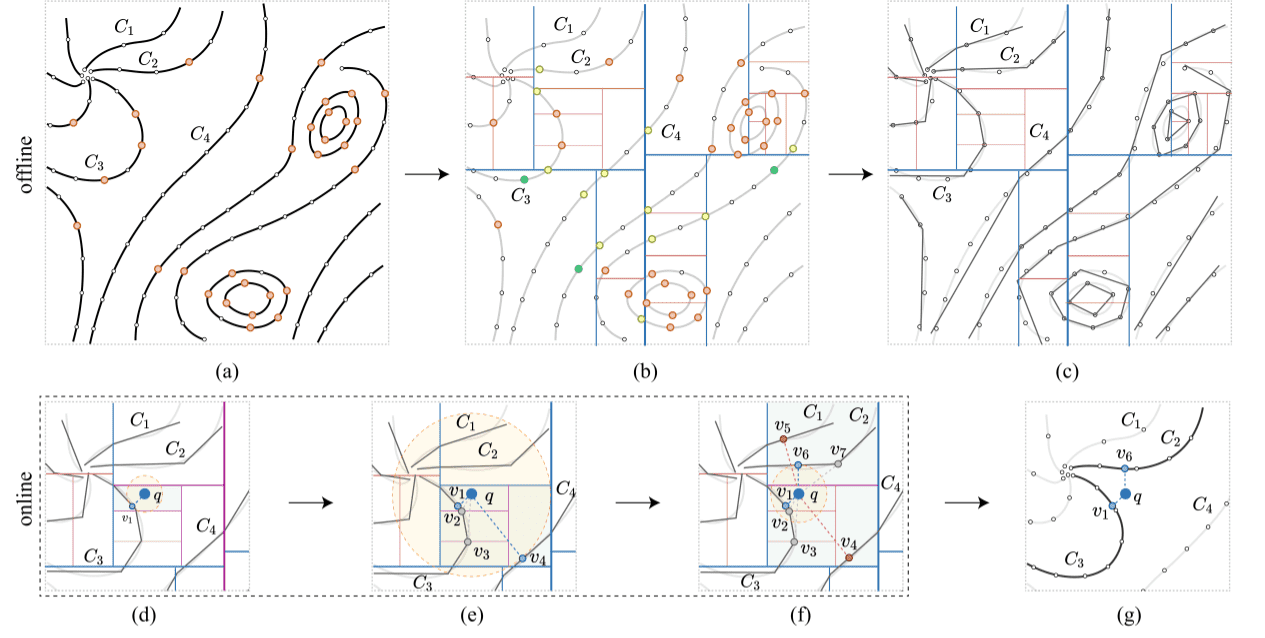
Figure 4: Overview of our two-stage method—offline pre-processing (a–c) and online query (d–g): (a) set of input curves with point samples (white) and split points (orange); (b) the CCH KD-treebuilt for the input curves with the removed split points (green) and the newly added split points (yellow), the split axes’ (blue) thickness indicates the level, where the thicker the lines are the higher levels of the KD-tree; (c) the curve segment in each grid cell is approximated by a straight-line segment; (d,e,f) three steps in retrieving the two nearest curves for the given query point , where the related split axes are highlighted in purple; (d) the first nearest curve with the nearest sample is found from the leaf node; (e) backtracking to the upper level and finding the two nearest samples and , which are from the same curve as , continued backtracking gives us a new nearest sample v4 from curve ; (f) further backtracking to find the nearest samples in the circle with radius from to . A closer sample is found, resulting in the fact that v4 and v5 (in red) are rejected; (g) the nearest curves are and and the corresponding nearest samples are and for query point .
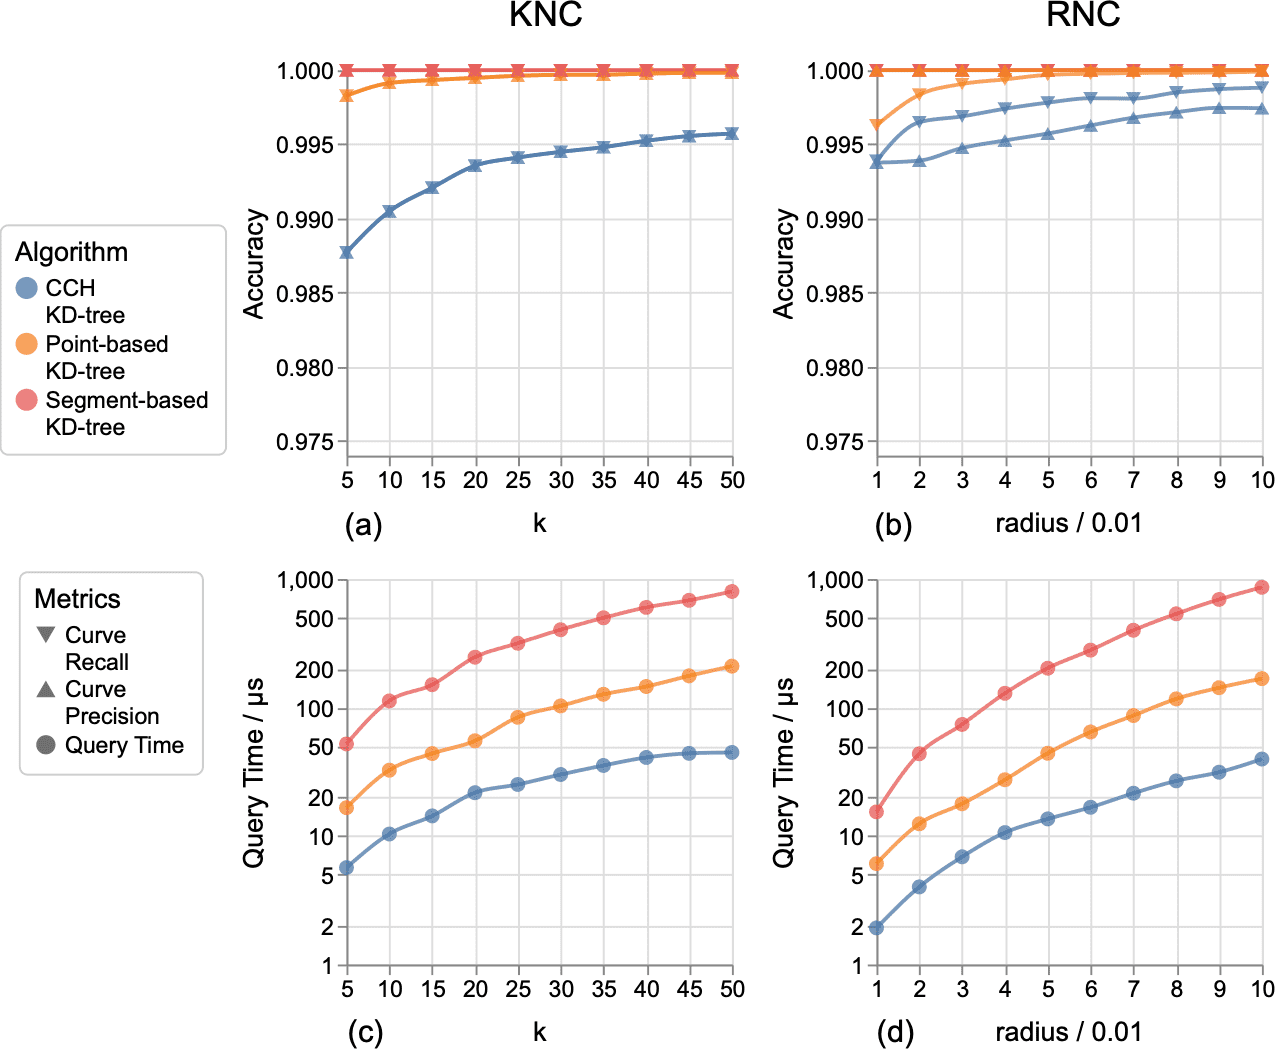
Figure 10: Comparing curve recall (downward triangles), curve precision (upward triangles), and query time (circle marks) of the three methods for performing KNC searches (a,b) and RNC searches (c,d) within the aneurysm dataset. Note that the lines of curve recall and curve precision overlap together in KNC search (a), while they might not overlap in RNC search (b).


