Data-Driven Colormap Optimization for 2D Scalar Field Visualization
Qiong Zeng1
YinqiaoWang1
Jian
Zhang2
Wenting Zhang1
Changhe Tu1
Ivan
Viola3
Yunhai Wang1
1Shandong University 2Computer Network Information Center, Chinese Academy of Sciences 3King Abdullah University of Science and TechnologyAccepted by IEEE Vis 2019 Short Papers |
|
Abstract:
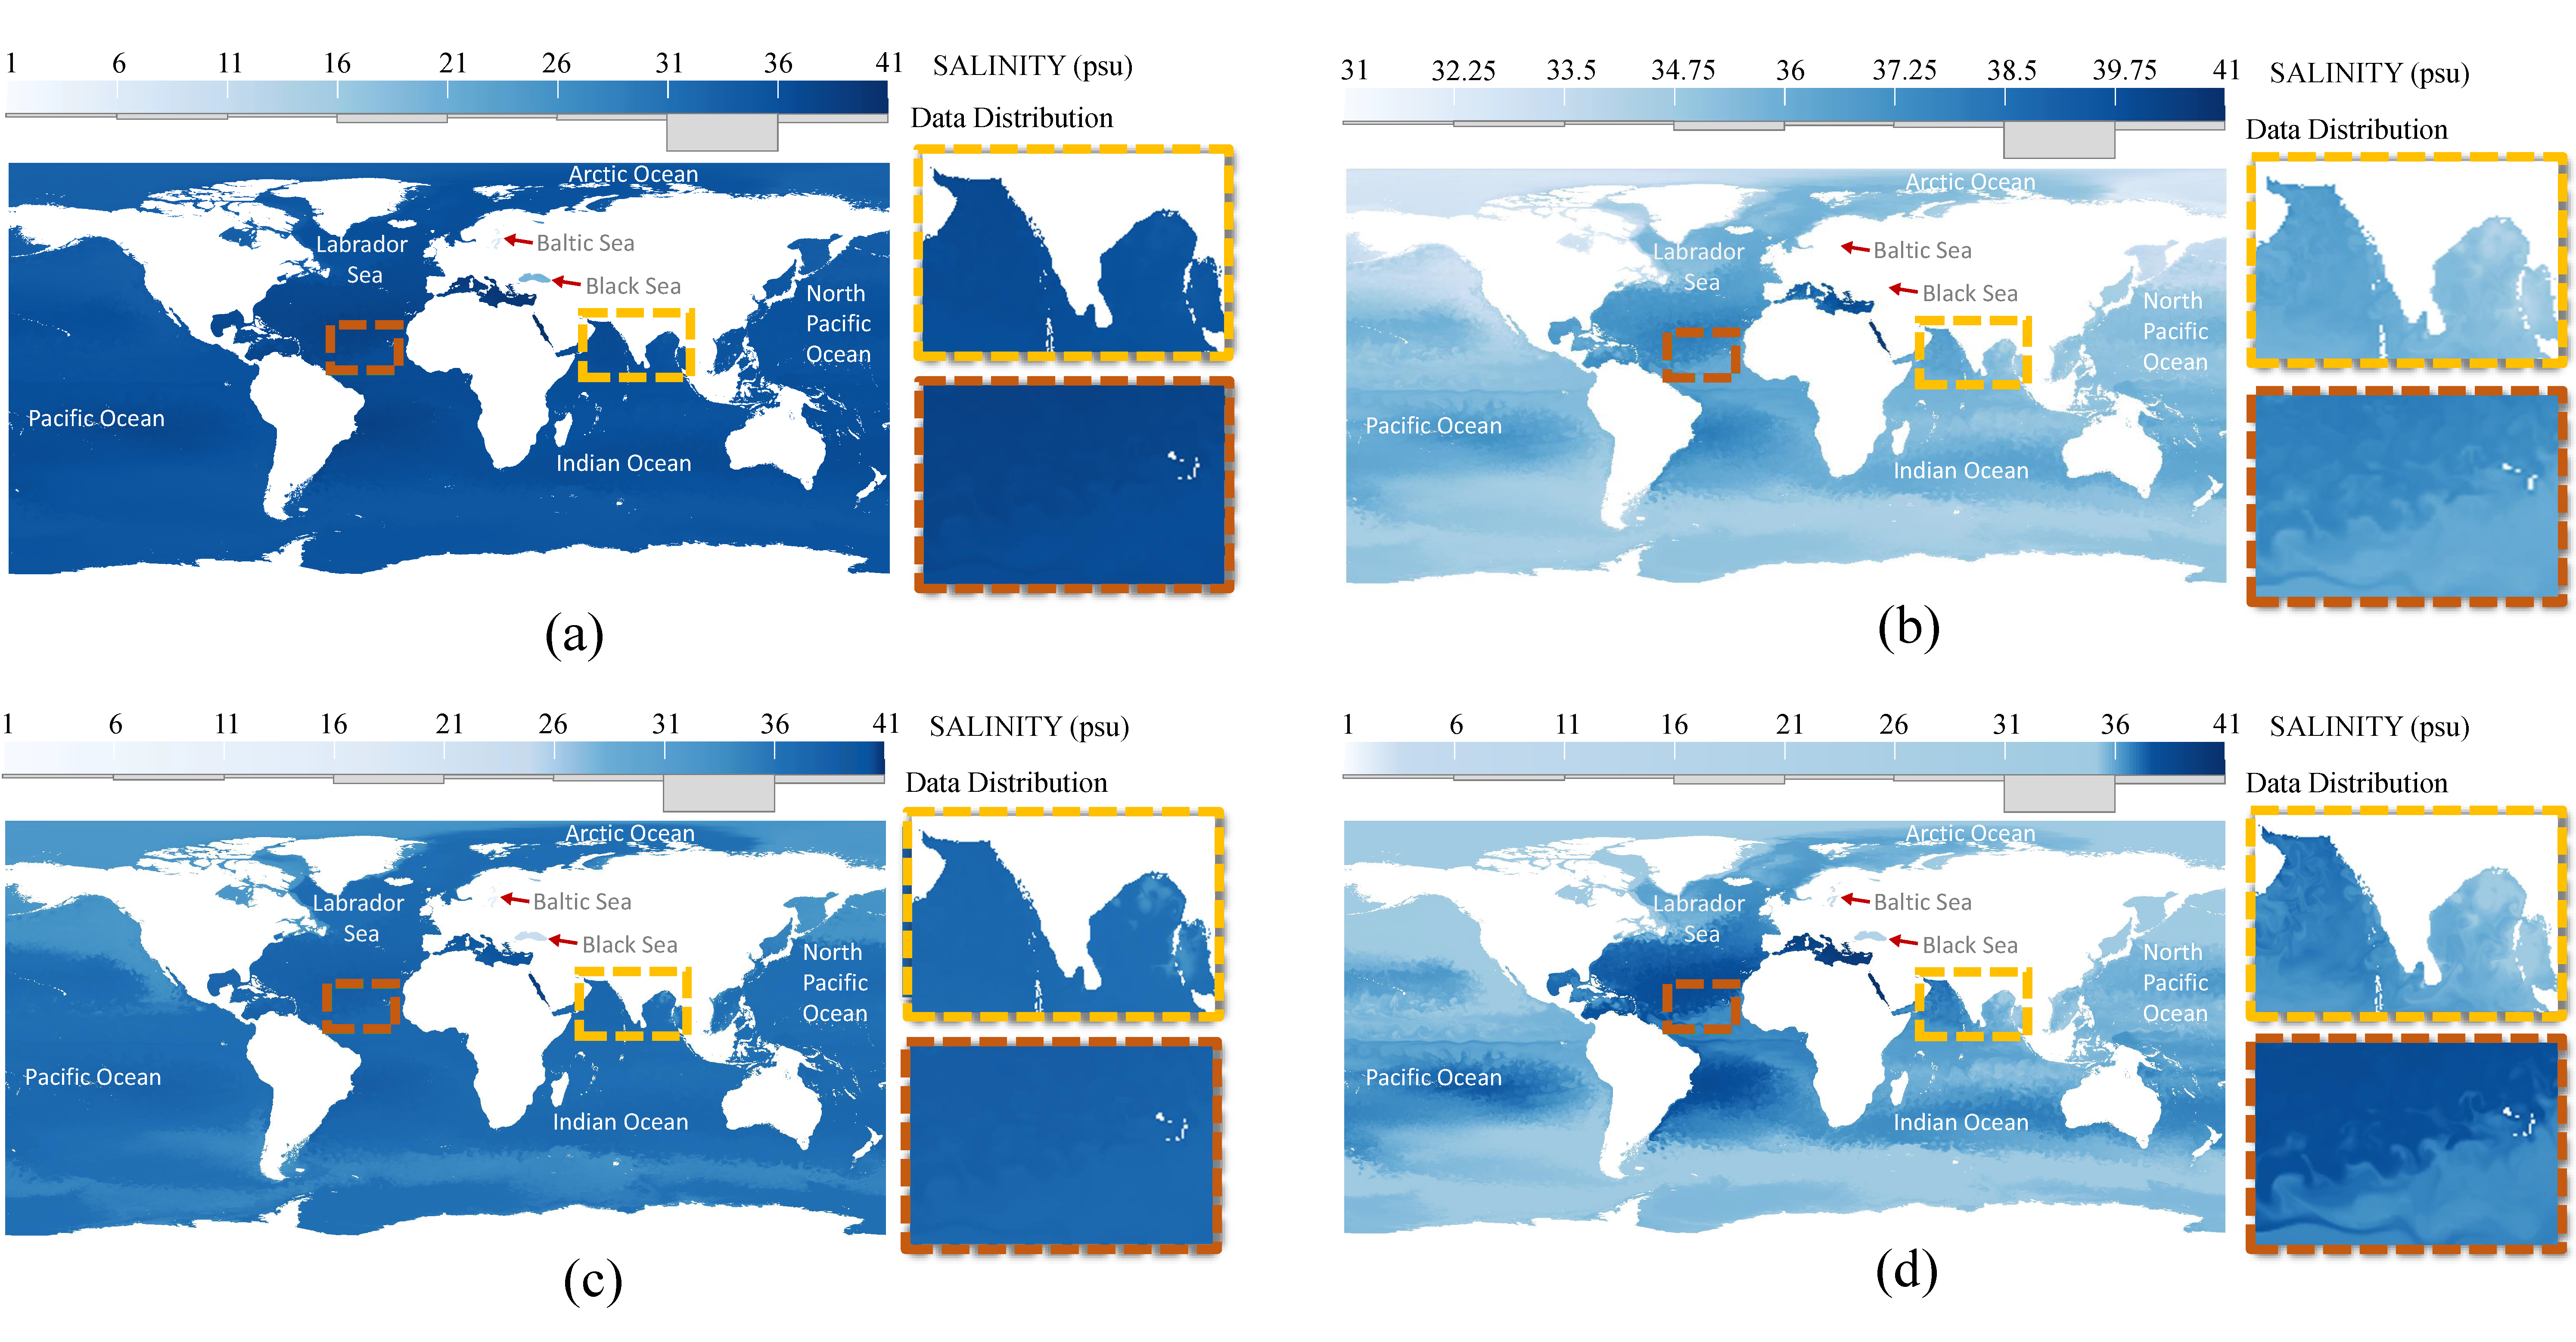
Colormapping is an effective and popular visual representation to analyze data patterns for 2D scalar fields. Scientists usually adopt a default colormap and adjust it to fit data in a trial-and-error process. Even though a few colormap design rules and measures are proposed, there is no automatic algorithm to directly optimize a default colormap for better revealing spatial patterns hidden in un- evenly distributed data, especially the boundary characteristics. To fill this gap, we conduct a pilot study with six domain experts and summarize three requirements for automated colormap adjustment. We formulate the colormap adjustment as a nonlinear constrained optimization problem, and develop an efficient GPU-based implementation accompanying with a few interactions. We demonstrate the usefulness of our method with two case studies. Video:
Acknowledgement:
This research was supported by the grants of NSFC (61602273, 61772315, 61861136012), Science Challenge Project (TZ2016002), and by the funding from King Abdullah University of Science and Technology (KAUST) under award number BAS/1/1680-01-01. This research used resources of the Core Labs of KAUST. The authors would also like to thank Kresimir Matkovic at VRVis Center for Virtual Reality and Visualisation GmbH (Vienna, Austria), Renata Raidou at TU Wien (Austria), Michael Böttinger at Deutsches Klimarechenzentrum (Germany), Thomas Theussl at KAUST (Saudi Arabia), Mingkui Li at Ocean University of China and Qianqian Guo at Shandong University (China) for providing precious visualization resources and evaluating the quality of our cases. Bibtex:
@inproceedings{colormapopt19, |