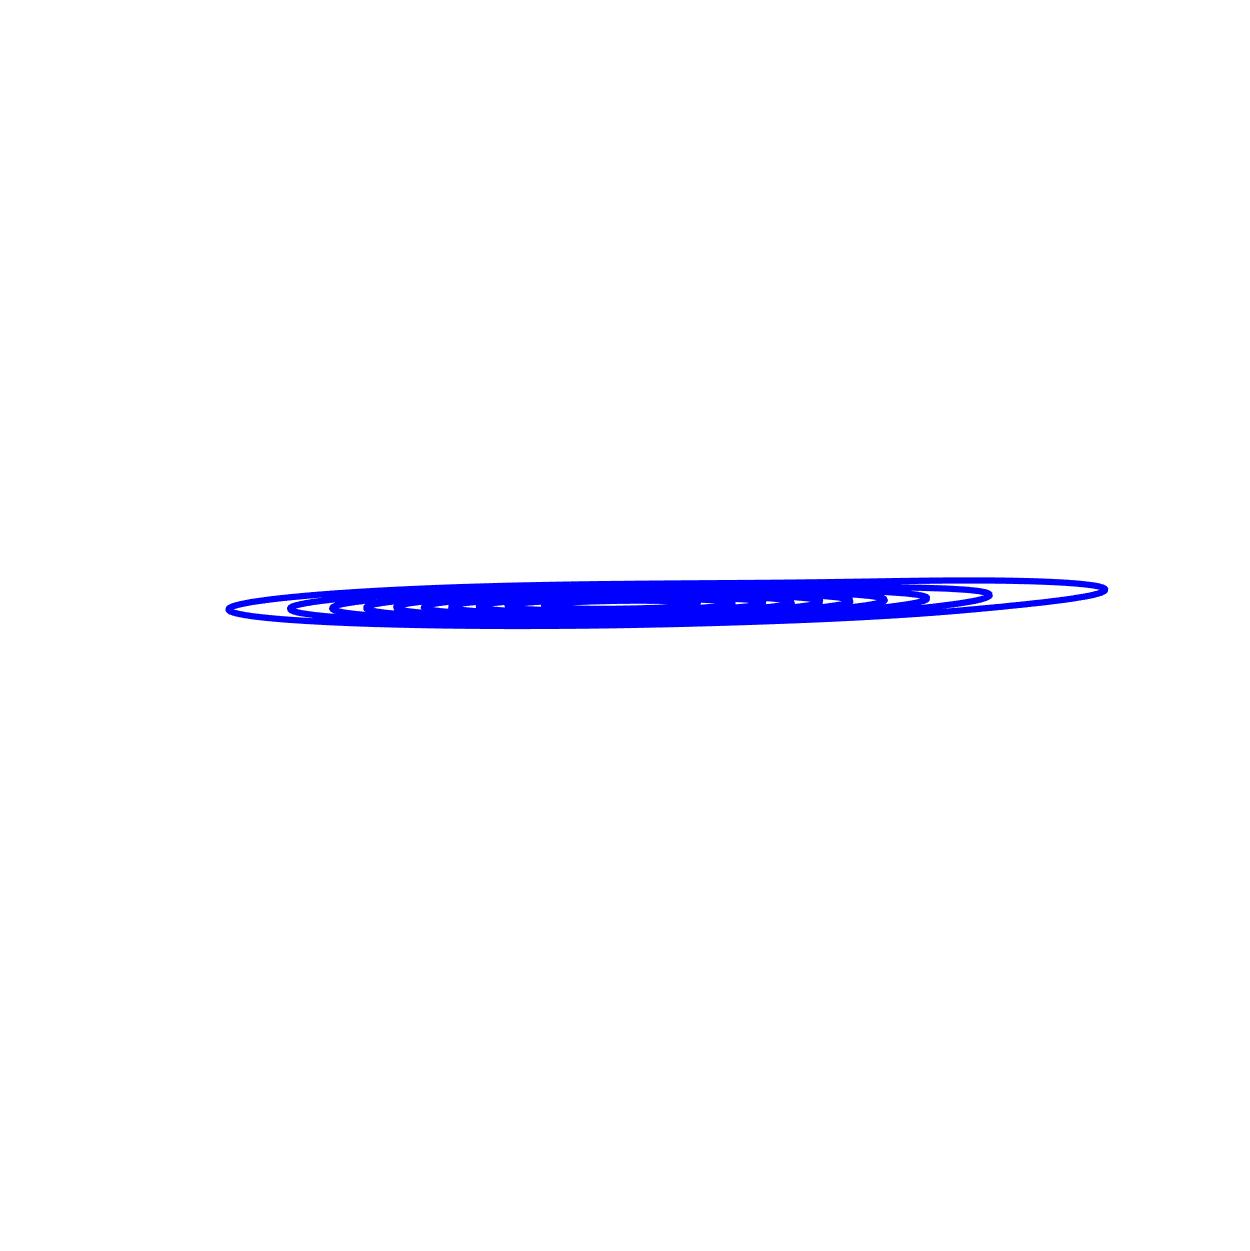
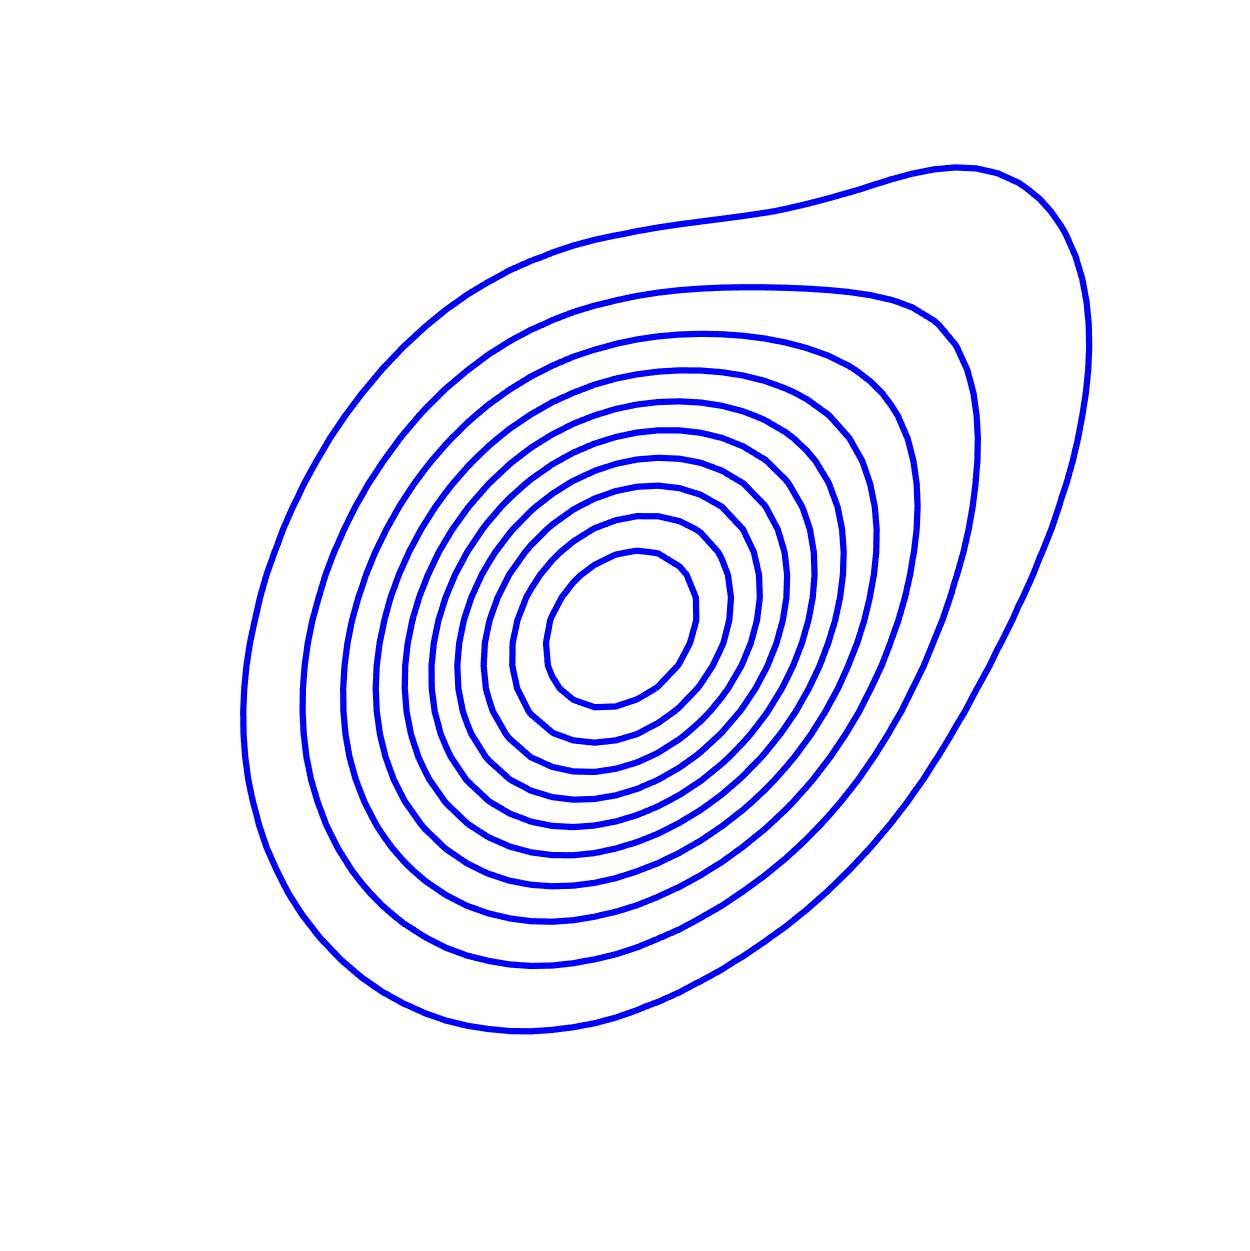
Comparison of 9 aspect ratio selection methods for 2D Contours
All images are clickable
Comprehensive protein-protein interaction maps promise to reveal many aspects of the complex regulatory network underlying cellular function. This data set was compiled by von Mering et al. (see reference below), combining various sources. Only the interactions that have ‘high’ and ‘medium’ confidence are included here.
Link
|
AL |
MS |
AS |
AWO |
AO |
yeast
|
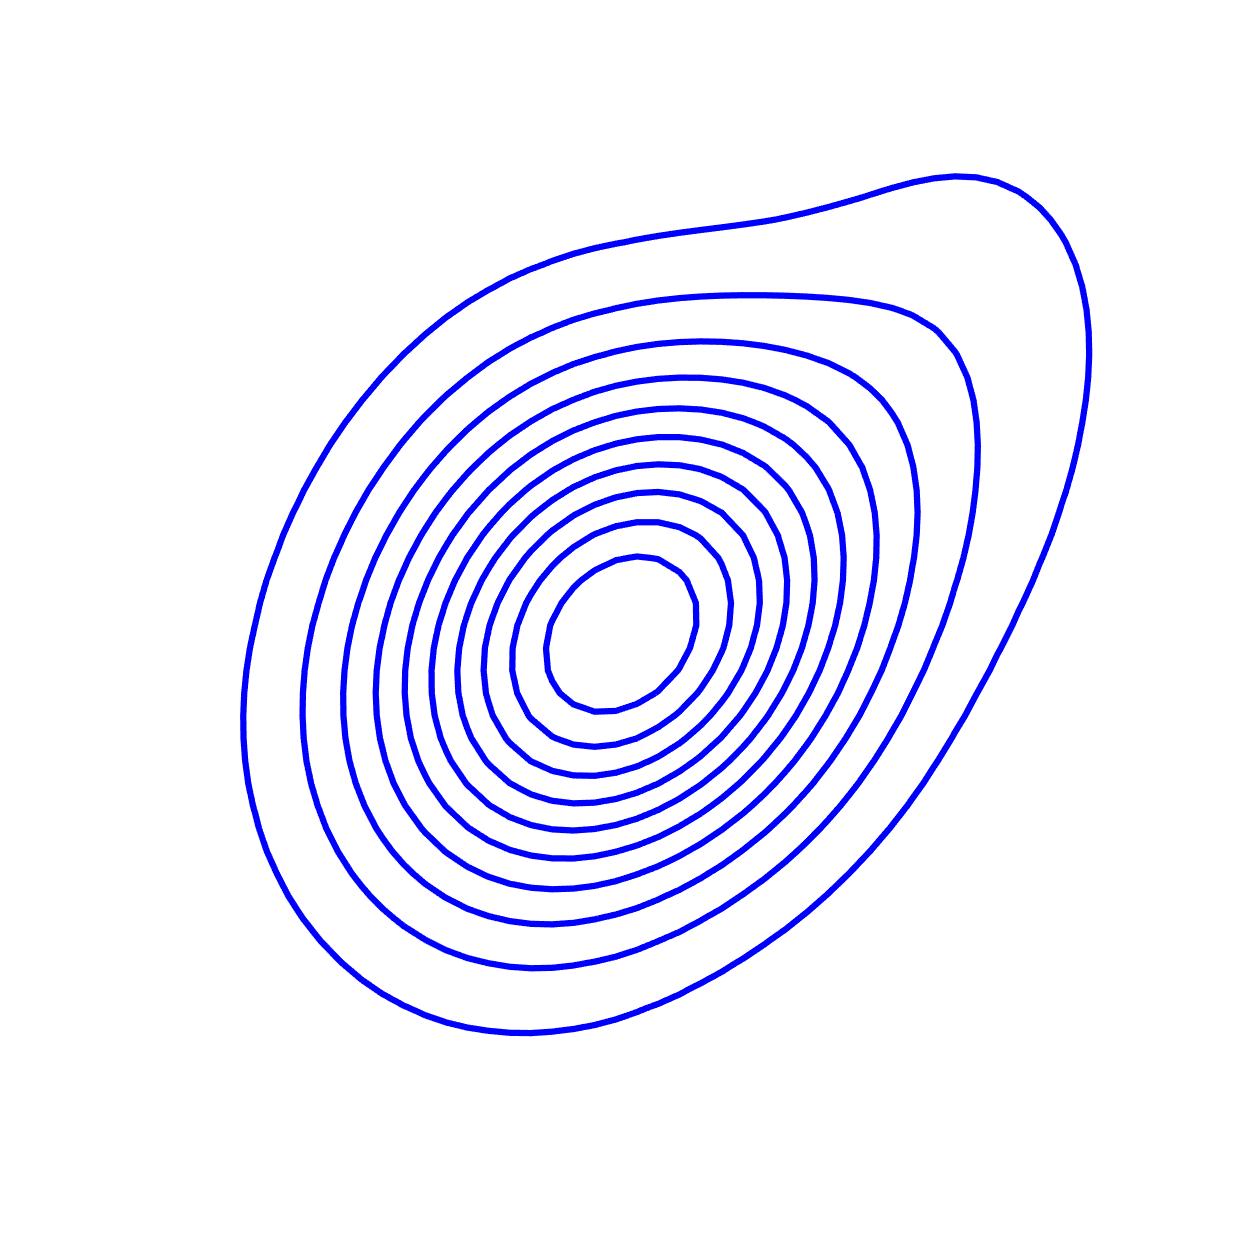 α = 1.0
|
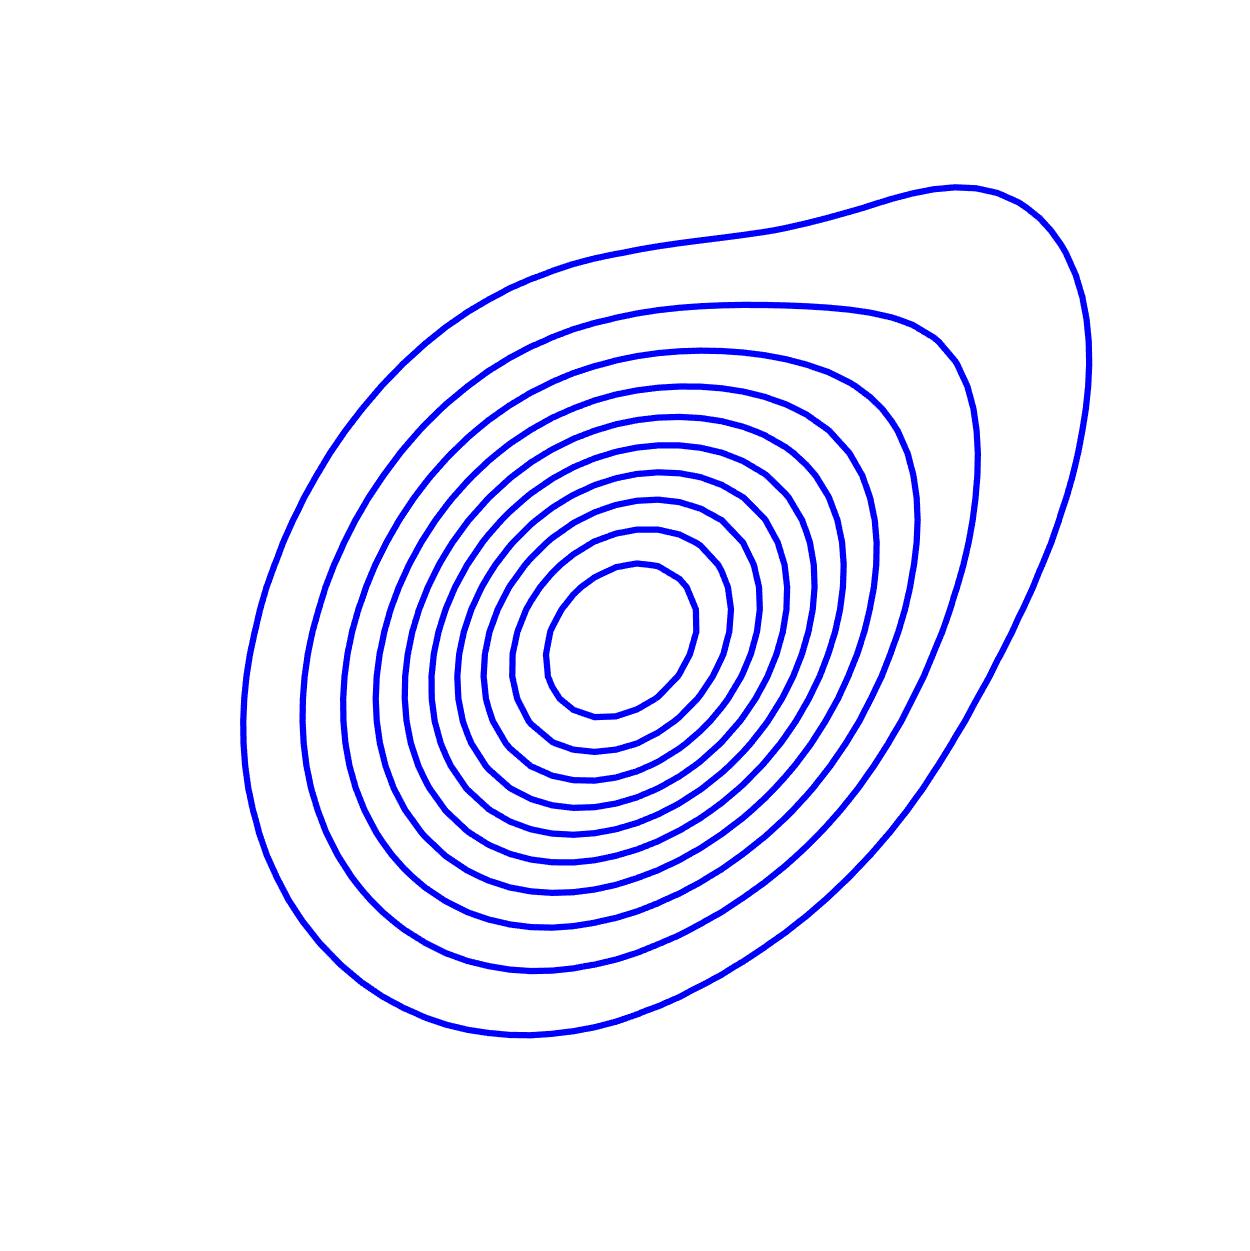 α = 0.9959
|
 α = 8.0E-4
|
 α = 1.0076
|
 α = 1.0012
|
| L1-LOR |
LOR |
GOR |
RV |
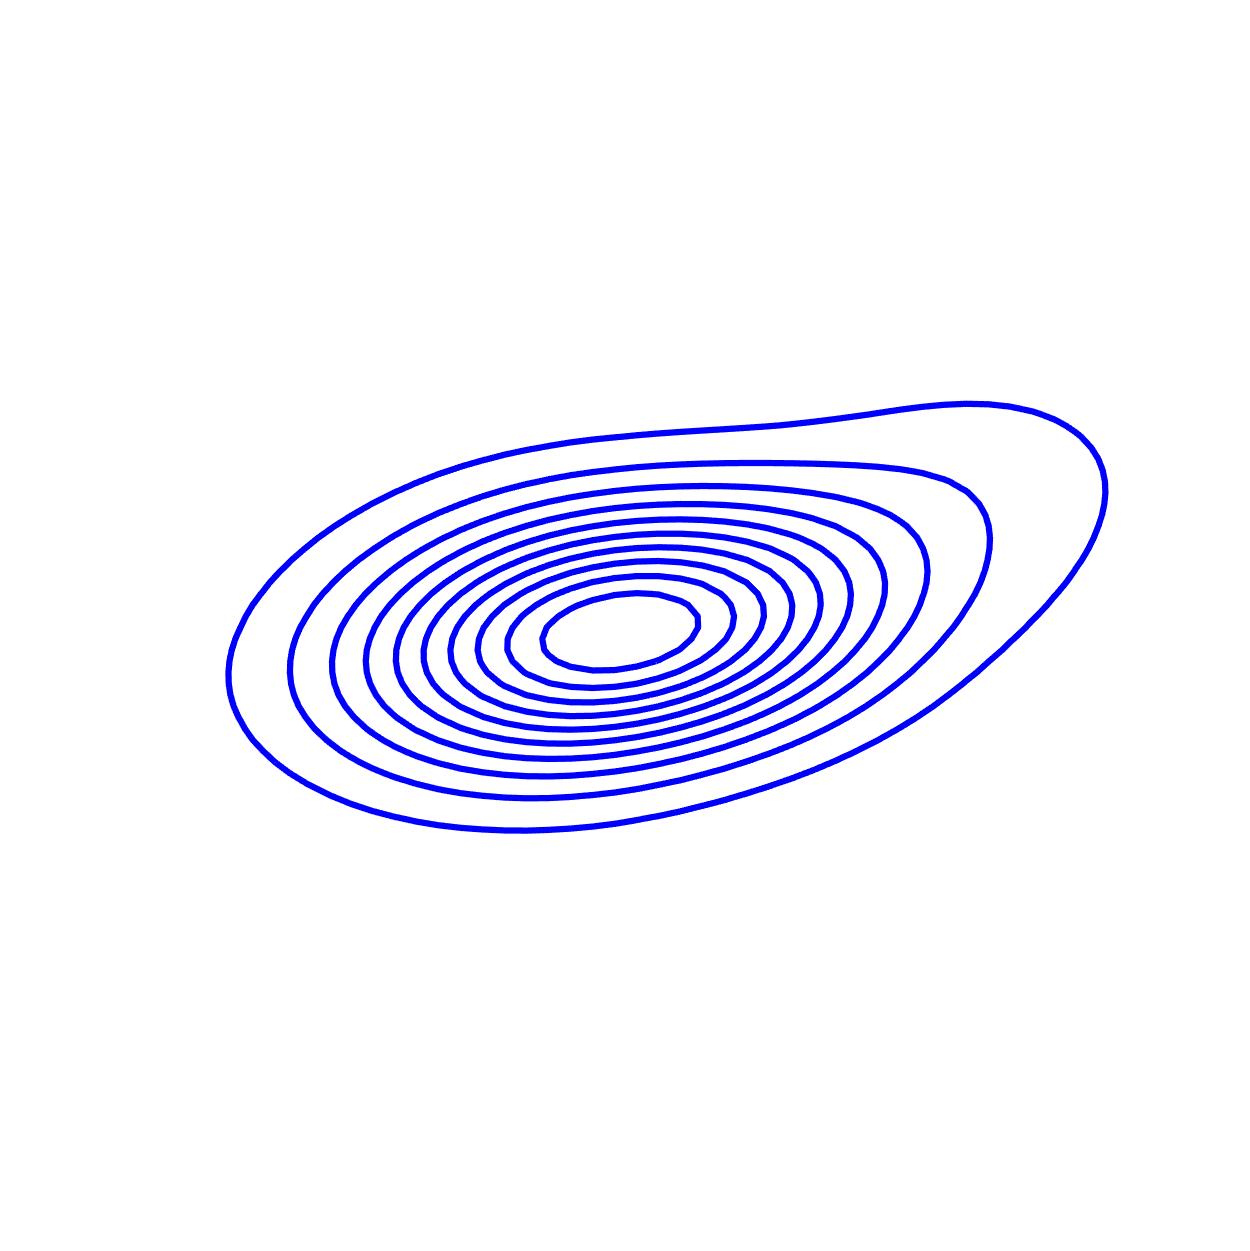 α = 0.4786
|
 α = 0.051
|
 α = 1.0043
|
 α = 0.9857
|