Optimizing Color Assignment for Perception of Class Separability in Multiclass Scatterplots
IEEE Transactions on Visualization and Computer Graphics (Proc. InfoVis 2018), 2019
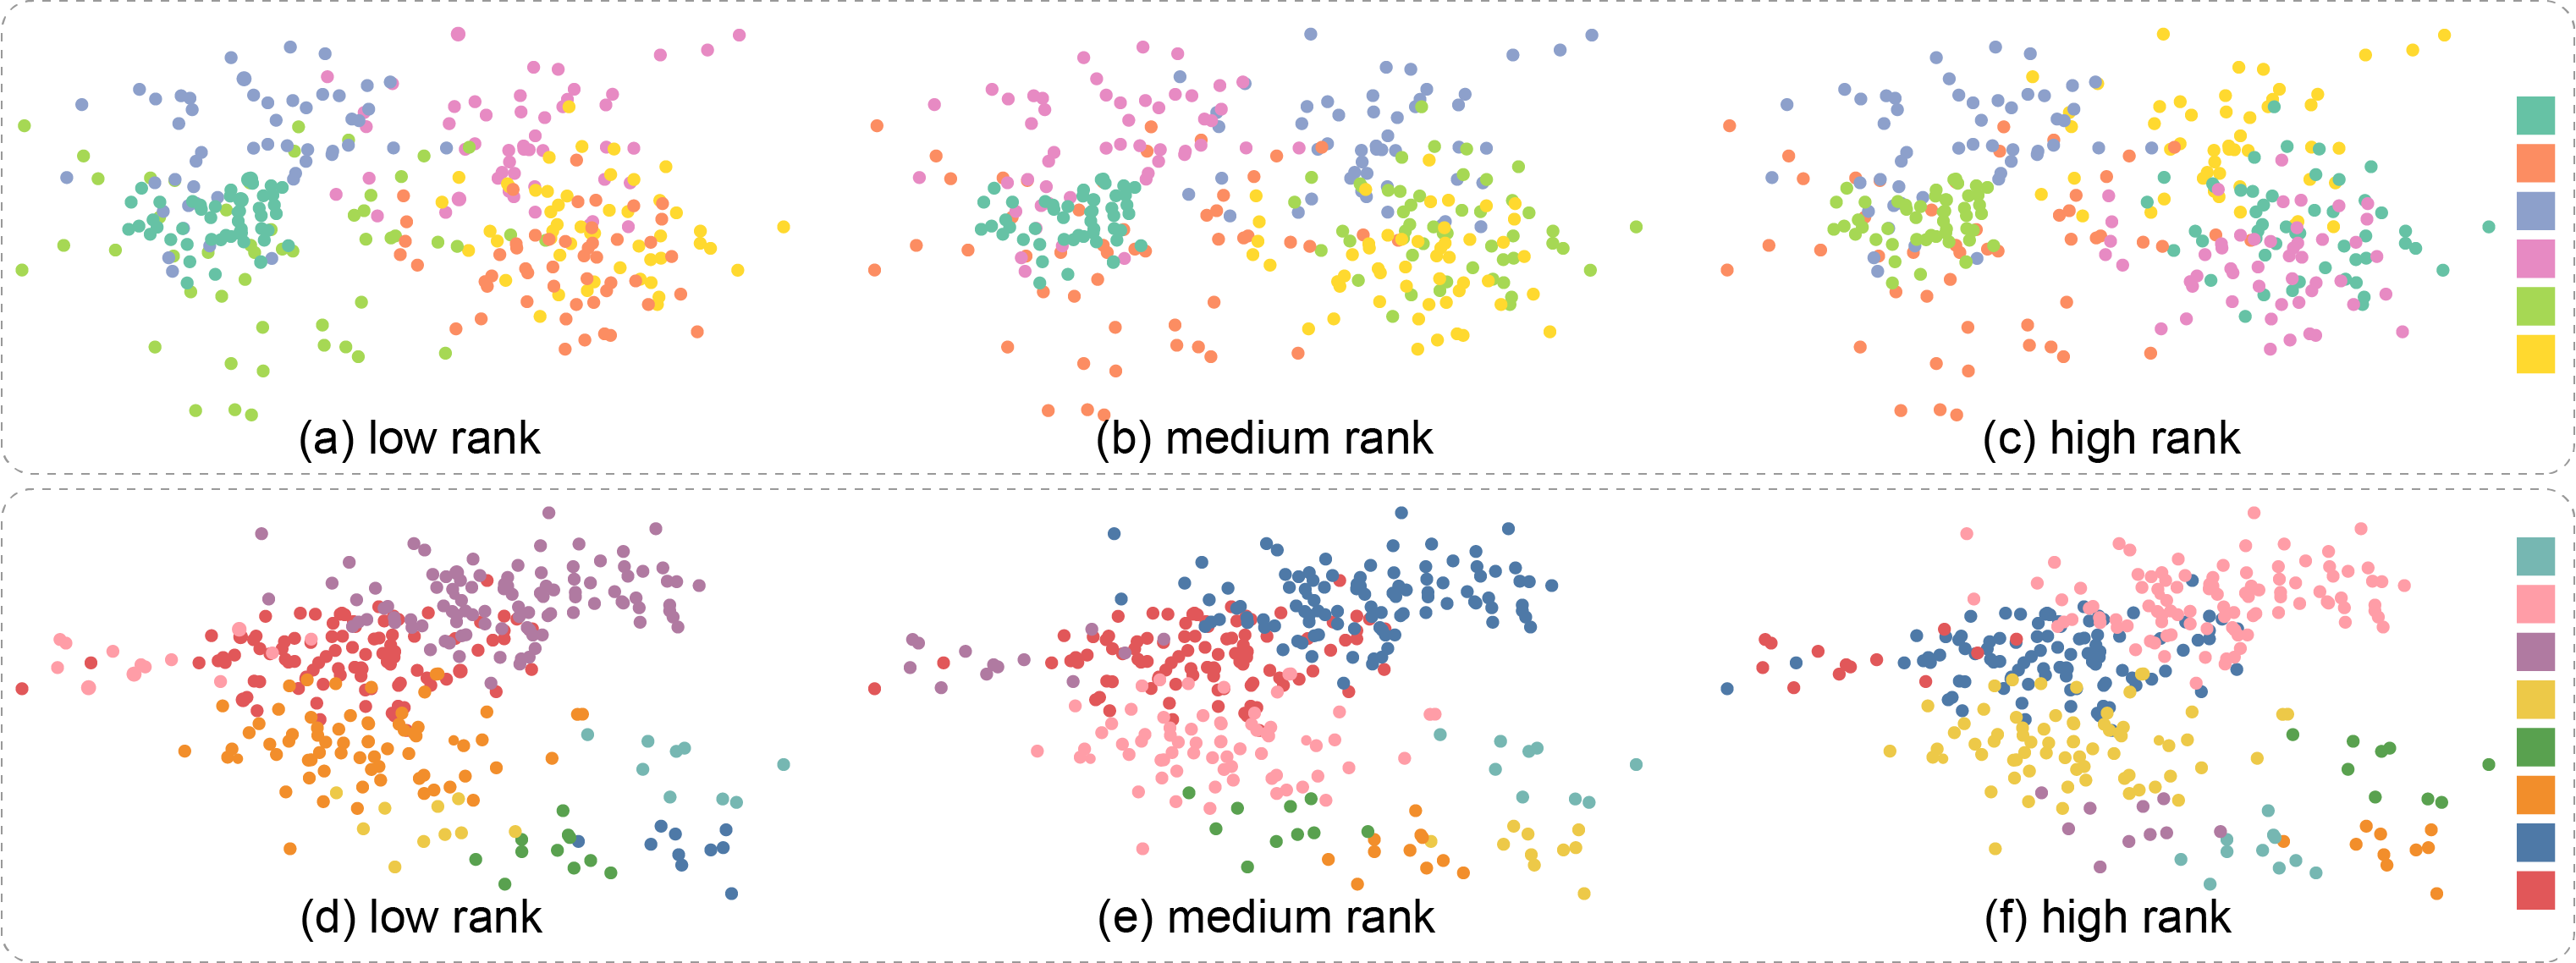
Figure 1: The color assignment has a strong influence on the visual separability of class structures shown in multiclass scatterplots. Here we show synthetically labeled six-class (top row) and eight-class (bottom row) datasets, and color palettes from ColorBrewer (a,b,c) and Tableau (d,e,f). Scatterplots are displayed from left to right using color assignments produced by our method with the lowest (i.e., poor) scores ranked by our separation measure (a,d) towards the one with the highest (i.e., best) scores (c,f).
Abstract:
Appropriate choice of colors significantly aids viewers in understanding the structures in multiclass scatterplots and becomes more important with a growing number of data points and groups. An appropriate color mapping is also an important parameter for the creation of an aesthetically pleasing scatterplot. Currently, users of visualization software routinely rely on color mappings that have been pre-defined by the software. A default color mapping, however, cannot ensure an optimal perceptual separability between groups, and sometimes may even lead to a misinterpretation of the data. In this paper, we present an effective approach for color assignment based on a set of given colors that is designed to optimize the perception of scatterplots. Our approach takes into account the spatial relationships, density, degree of overlap between point clusters, and also the background color. For this purpose, we use a genetic algorithm that is able to efficiently find good color assignments. We implemented an interactive color assignment system with three extensions of the basic method that incorporates top K suggestions, user-defined color subsets, and classes of interest for the optimization. To demonstrate the effectiveness of our assignment technique, we conducted a numerical study and a controlled user study to compare our approach with default color assignments; our findings were verified by two expert studies. The results show that our approach is able to support users in distinguishing cluster numbers faster and more precisely than default assignment methods.Materials:
Paper: [PDF 3.62M].
Supp: [ZIP 7.94M].
System: Interactive Color Assignment System.
Results:

Figure 2: Exploring the influence of λ on the selected color assignment: (a) result generated by only considering the color contrast with background; (b) result generated with λ set to 0.1; (c) result generated with λ set to 0.3; and (d) result generated by considering only the point distinctness.
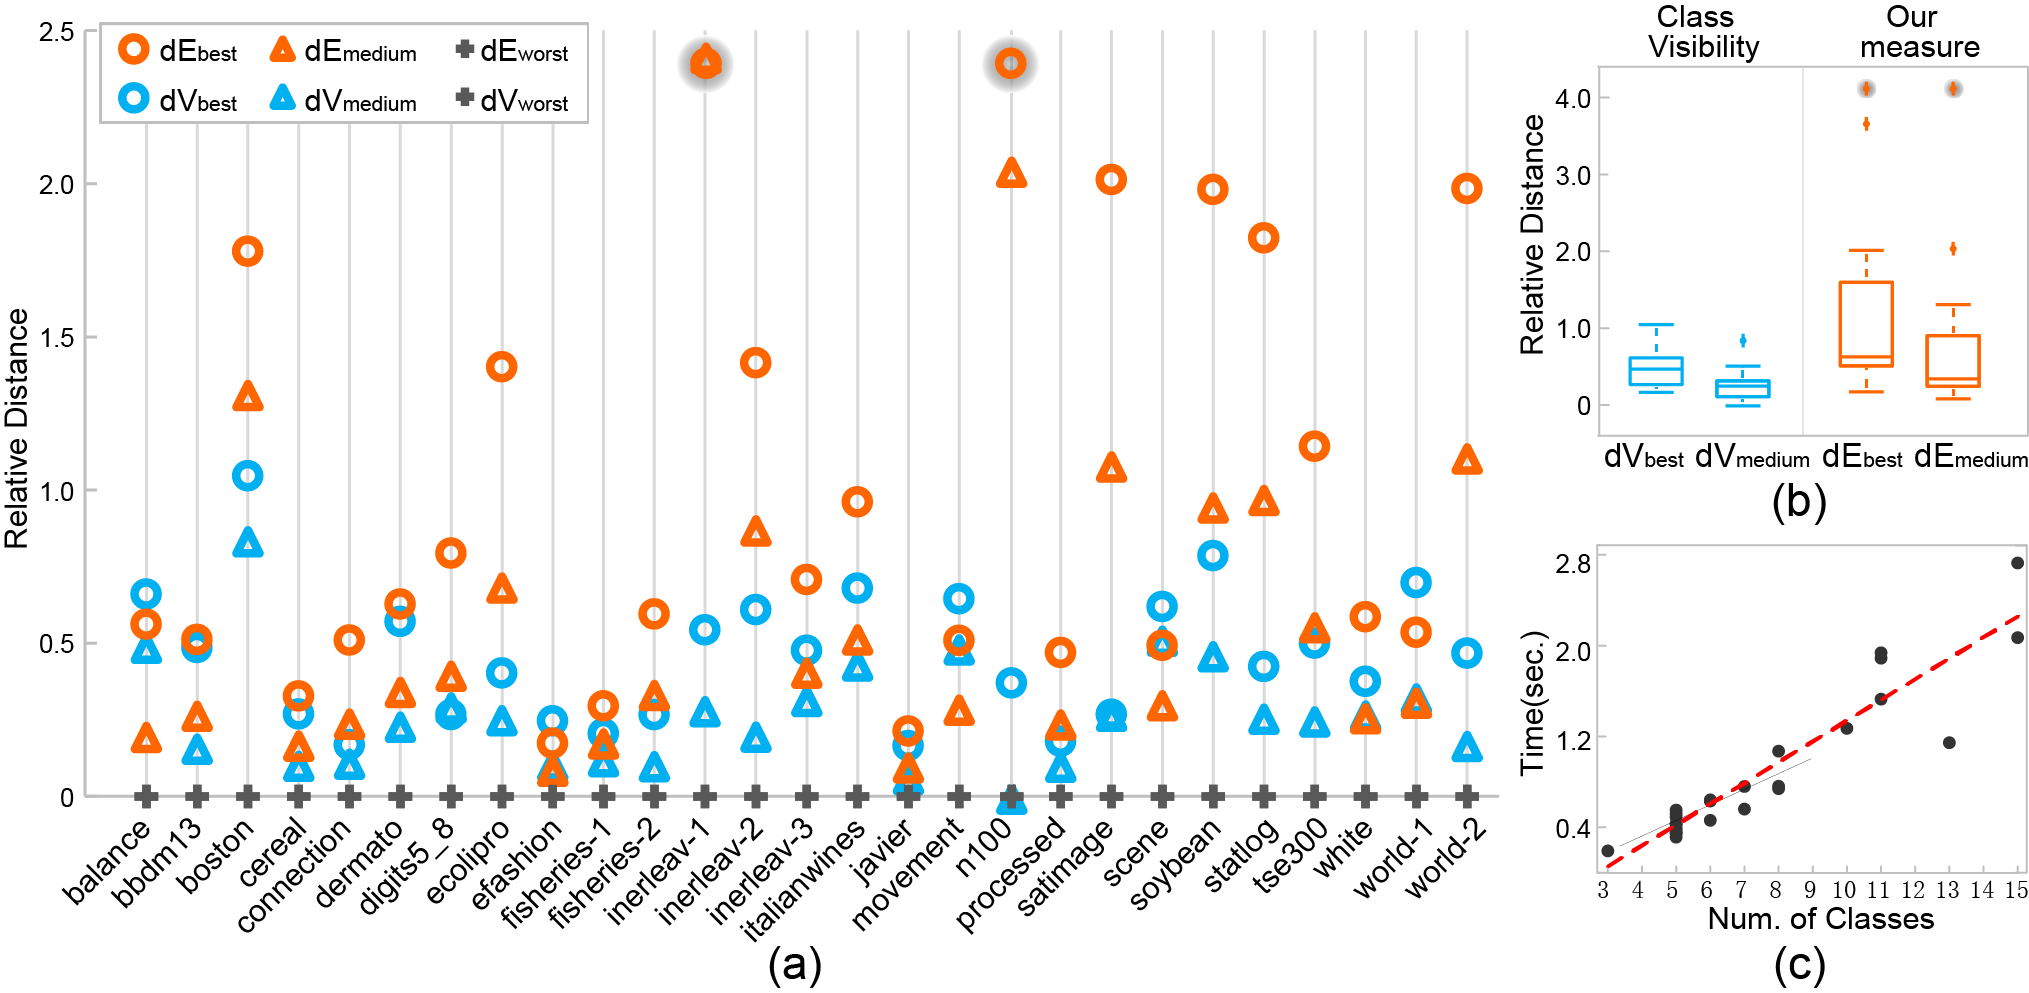
Figure 3: (a) Comparison of our measure and class visibility using the values of dE best , dE medium , dV best , and dV medium for each dataset; (b) boxplots summarizing the values of the four variables in (a); and (c) scatterplot with a red trend line, showing the relationship between computation time and the number of classes.
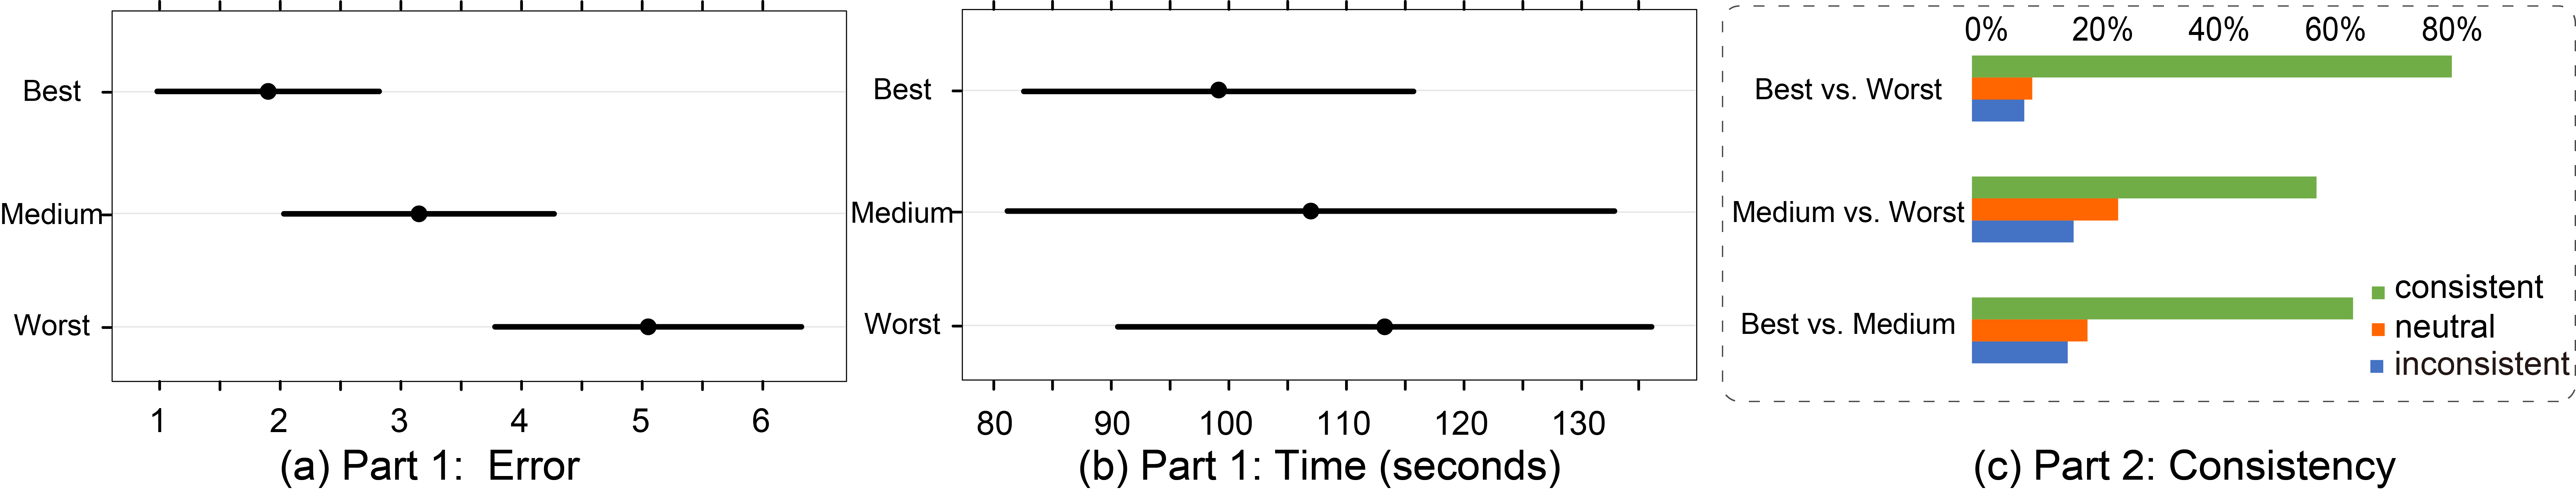
Figure 4: Results of the lab studies. For part 1, we show mean values and deviation as 95% CIs of (a) user error, (b) time (lower values are better). For part 2, we display the consistency between people’s choice and the rating of our method (c). If the user chose the better scatterplot of a pair, the choice was marked with “consistent,” otherwise “inconsistent.” If they choose “No preference,” the result was “neutral.”
Acknowledgement:
This work is supported by the grants of NSFC (61772315), Science Challenge Project (TZ2016002), Shandong Provincial Natural Science Foundation (ZR2016FM12), Leading Talents of Guangdong Program (00201509) and Fundamental Research Funds of Shandong University.