Optimally Ordered Orthogonal Neighbor Joining Trees for Hierarchical Cluster Analysis
Tong Ge1
Xu Luo1
Yunhai Wang1
Michael Sedlmair2
Zhanglin Cheng3
Ying Zhao4
Xin Liu5
Oliver Deussen6
Baoquan Chen7
1Shandong University
2University of Stuttgart
3Shenzhen Institute of Advanced Technology, Chinese Academy of Sciences,
Shenzhen.
4Central South University
5Beijing Genomics Institute
6University of Konstanz
7Peking University
Accepted by TVCG
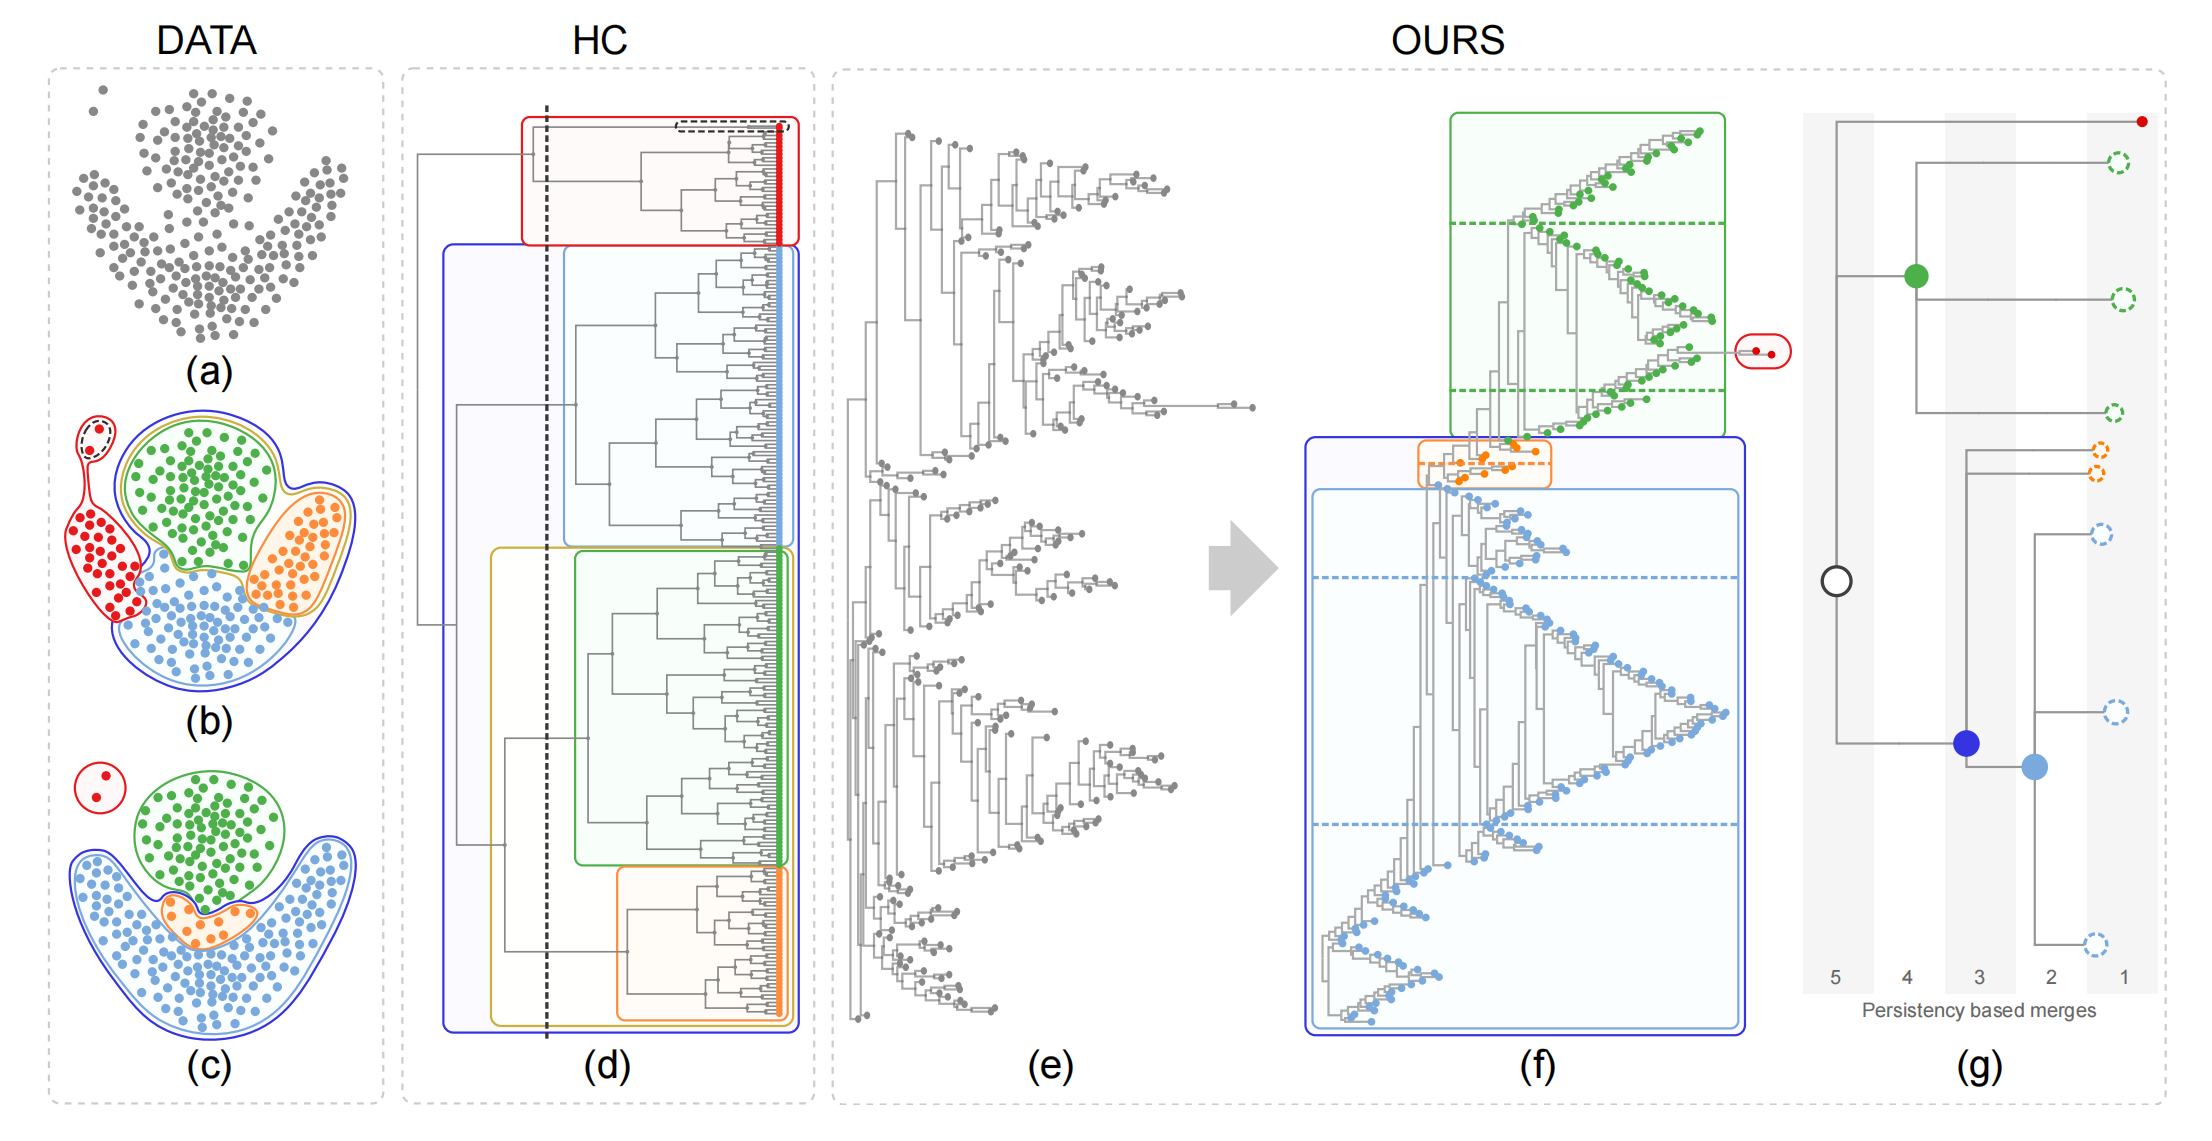
Figure 1:
A given dataset (a) is better clustered by our optimally ordered orthogonal neighbor joining tree (O3NJTree)
(f) than by a dendrogram (d)
produced by the hierarchical clustering (HC) method with complete linkage. Subfigure (b) shows the nested
five clusters generated by cutting the
dendrogram with a minimum similarity bar; (c) shows four clusters automatically extracted with our method;
(e) displays the NJ tree with random leaf
order while (f) shows the same tree with optimal leaf order (left) and resulting cluster tree (right) as
described in the paper.
Abstract:
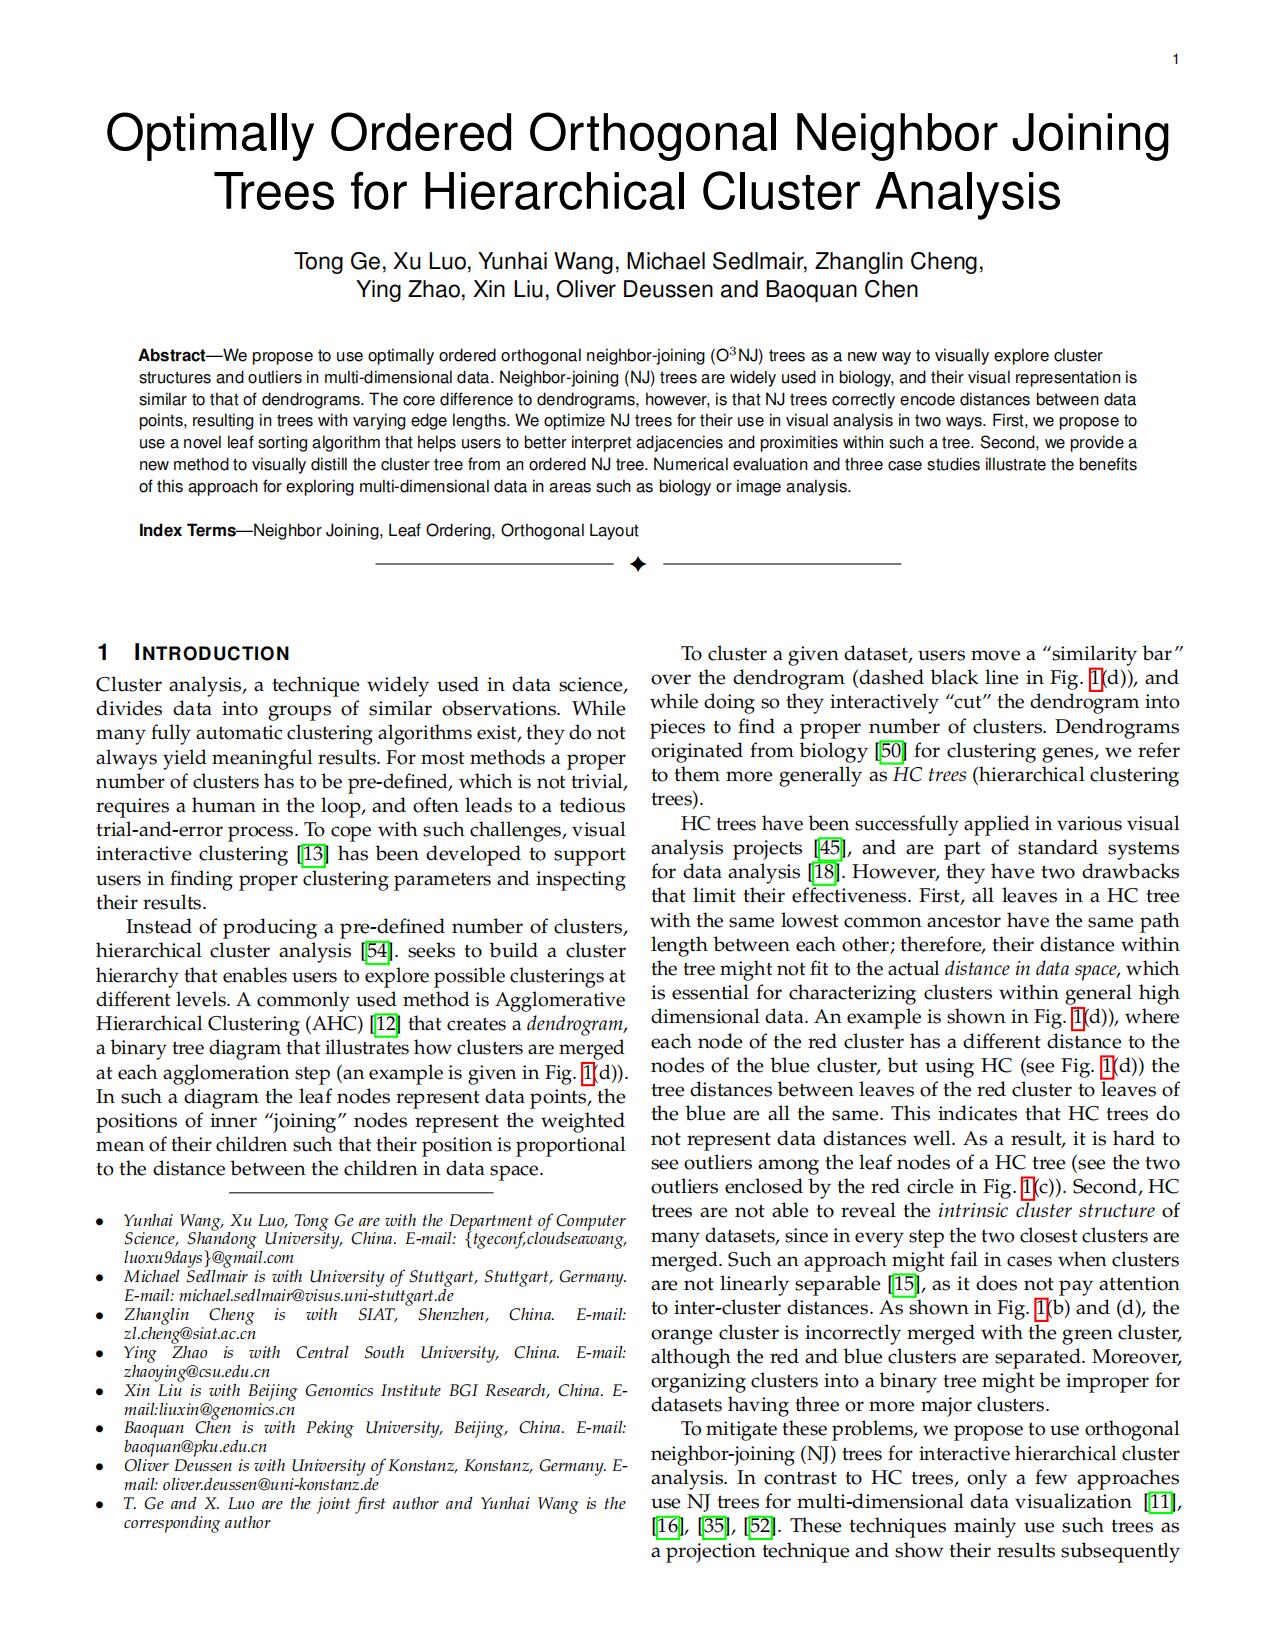
We propose to use optimally ordered orthogonal neighbor-joining (O3NJ) trees as a new way to visually explore cluster structures and outliers in multi-dimensional data. Neighbor-joining (NJ) trees are widely used in biology, and their visual representation is similar to that of dendrograms. The core difference to dendrograms, however, is that NJ trees correctly encode distances between data points, resulting in trees with varying edge lengths. We optimize NJ trees for their use in visual analysis in two ways. First, we propose to use a novel leaf sorting algorithm that helps users to better interpret adjacencies and proximities within such a tree. Second, we provide a new method to visually distill the cluster tree from an ordered NJ tree. Numerical evaluation and three case studies illustrate the benefits of this approach for exploring multi-dimensional data in areas such as biology or image analysis.
Results:
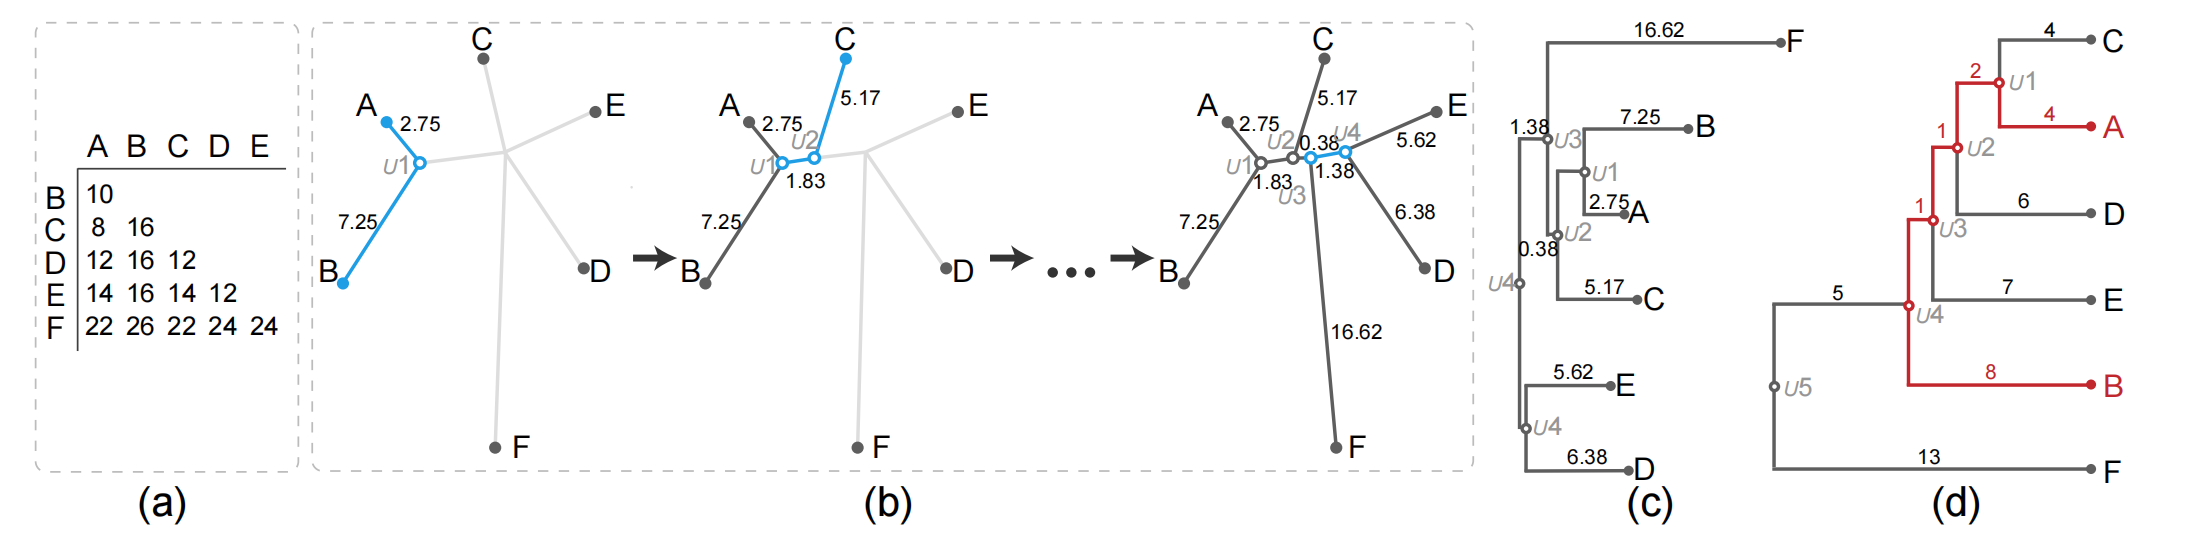
Figure 2: Illustration of the NJ algorithm and comparison between an NJ tree and a HC tree. (a) input distance matrix; (b) creating the NJ algorithm by using the input distance matrix; (c) orthogonal NJ tree where the root is the duplication of U4; (d) HC tree generated by applying the AHC method with average linkage according to the matrix in (a).
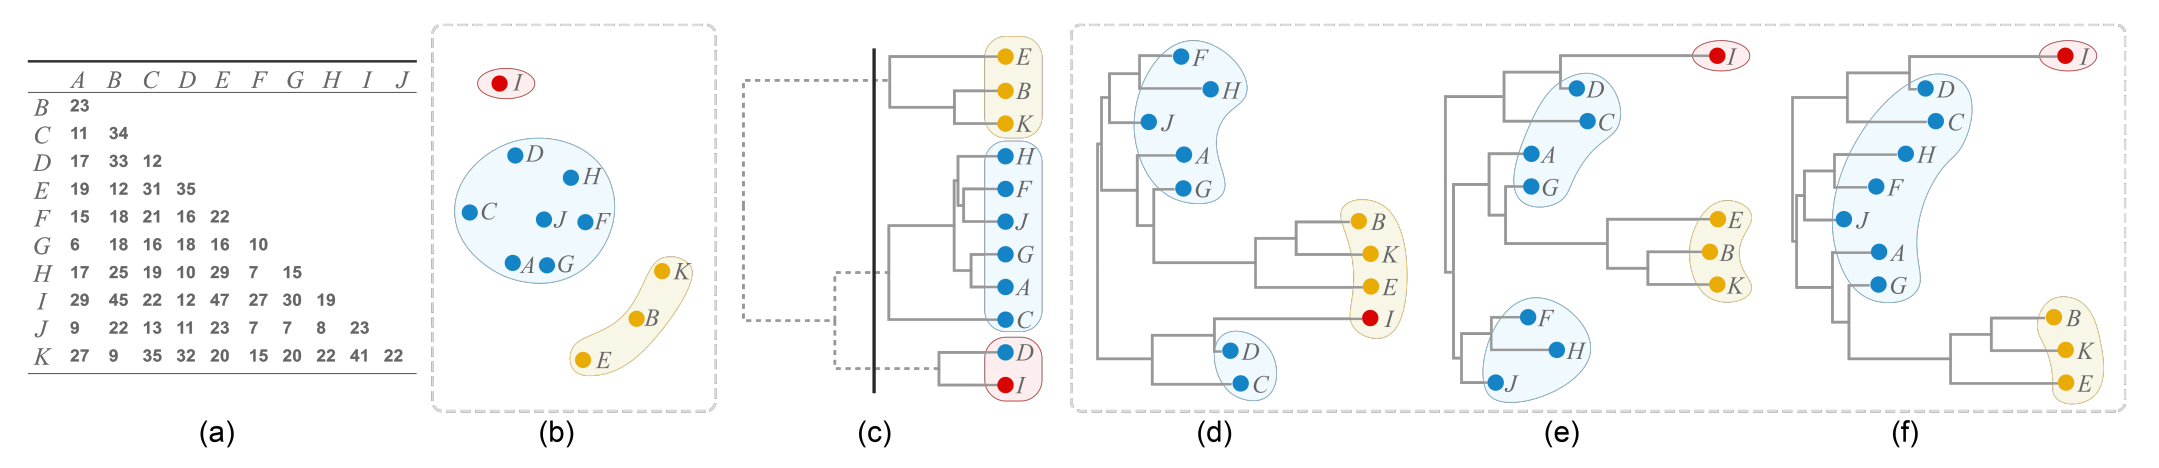
Figure 3: Comparison between ordinal hierarchical clustering (HC) and NJ trees generated from the same distance matrix as shown in (a). (b) Scatter plot with three clusters produced by multi-dimensional scaling; (c) HC tree where positions do not accurately resemble distances, e.g., the distance between I and A is 29 and the distance between I and B is 45, but the horizontal position of their least common ancestor (the root node) has the same horizontal path length to the nodes I, A and B. Moreover, cutting the HC tree into three branches (black line) results in incorrect groupings for I and D. NJ trees accurately encode the distance matrix, but so far no good ordering algorithm exists: (d) NJ tree displayed with a random order, as currently done in an R package [36]; (e) NJ tree ordered by using the OLO algorithm [3]; (f) NJ tree ordered by our algorithm, three useful clusters are created.
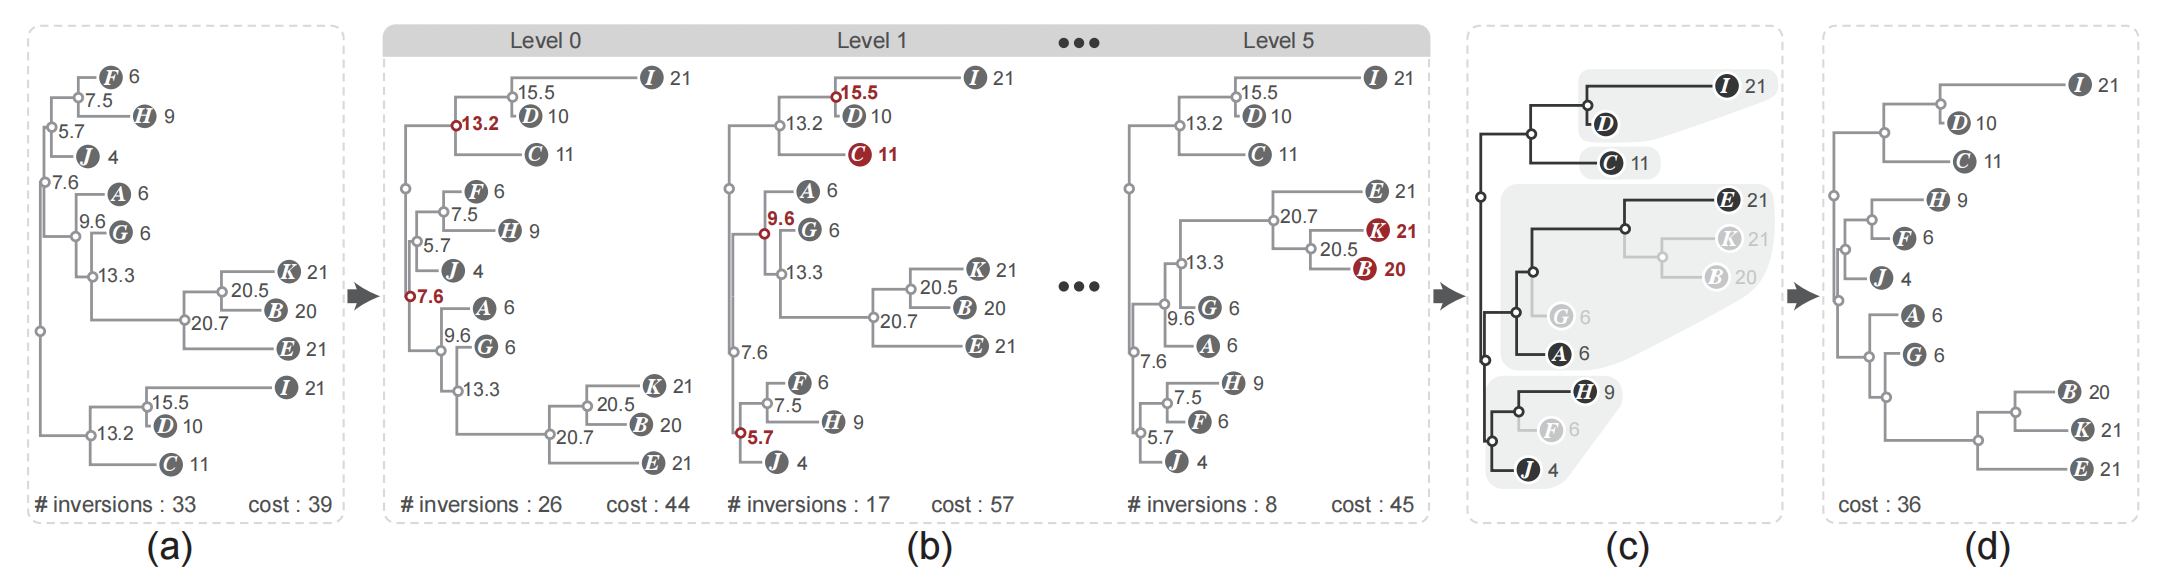
Figure 4: Overview of our leaf ordering algorithm: (a) an orthogonal NJ tree with unequal edge length where each node is assigned a weight based on the edge length; (b) by performing monotonicity based flipping within a breadth-first traversal the inversion is reduced; (c) extraction of the ordered sub-trees with a depth-first traversal; (d) the optimal leaf ordering result is obtained by applying the DP algorithm to the ordered sub-trees.
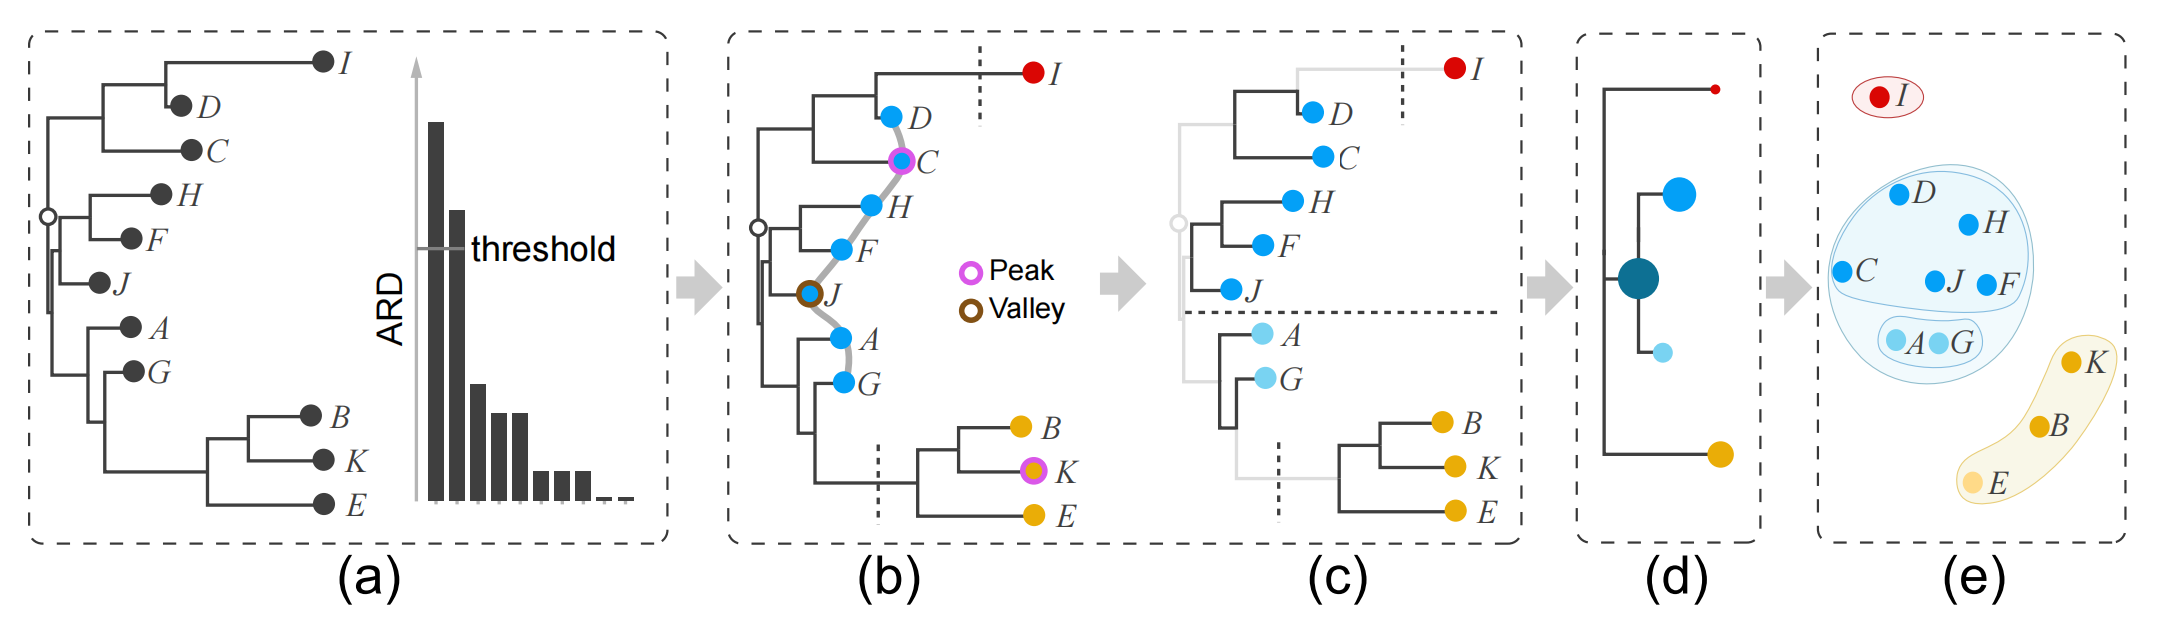
Figure 5: Distilling the cluster tree from an O3NJ tree includes splitting and hierarchy extraction: (a) input O3NJ tree and a histogram of the ARD values; (b) the selected threshold from the histogram in (a) cuts the tree into three parts; (c) identified peaks and valleys as well as corresponding two-level cluster tree for the middle branch; (d) distilled cluster tree and nested clusters shown as scatter plot (right).
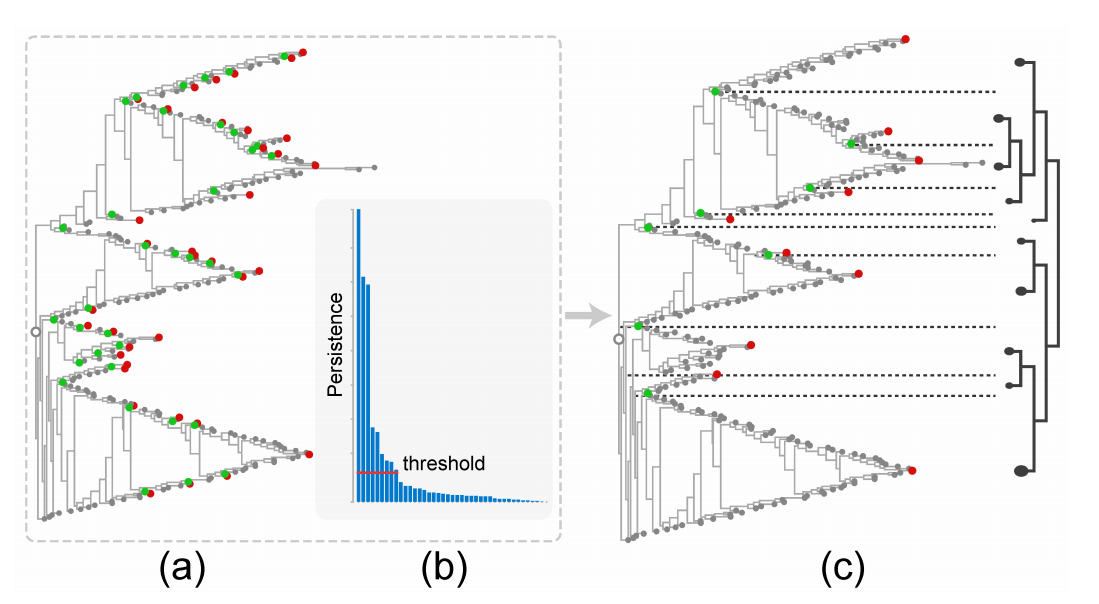
Figure 6: Persistence-inspired simplification of an O3NJ tree: the optimally ordered version of Fig. 1(e) is the input shown in (a), a default threshold of 10% of the maximal persistence value shown in the persistence histogram in (b) removes most noisy peaks and valleys and results in the cluster hierarchy shown in (c).
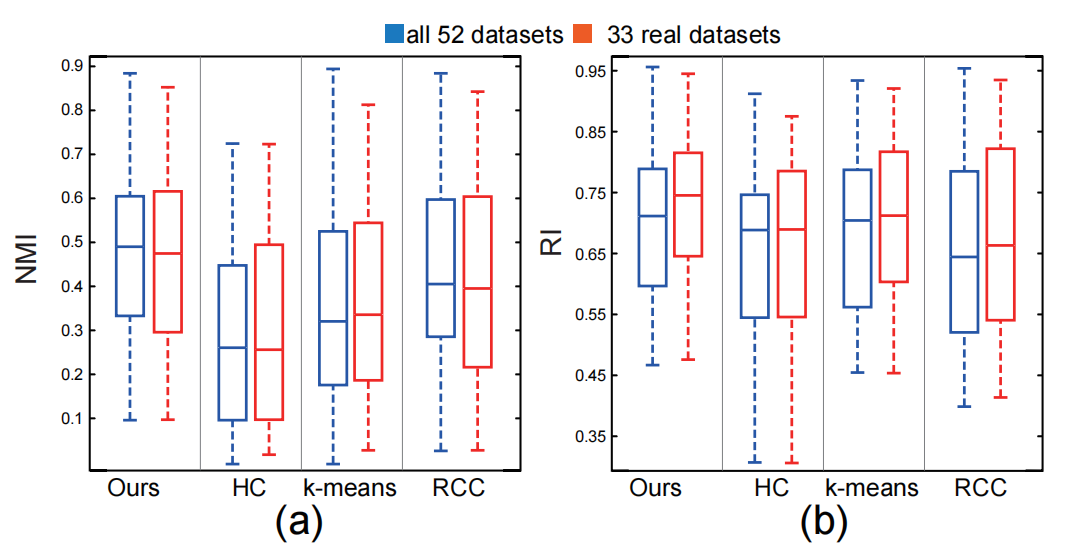
Figure 7: Values of NMI (a) and RI (b) for the four different clustering methods: the blue boxplots show the score distributions over all 52 datasets and red boxplots give the score of the 33 real datasets.
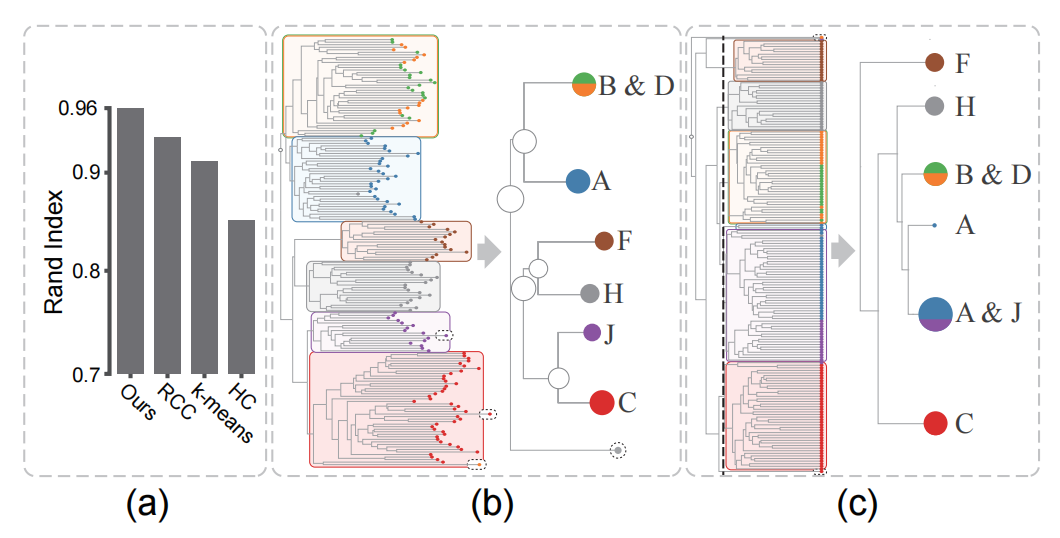
Figure 8: (a) Clustering accuracy of the Isolet data generated by different methods, (b) cluster trees produced by our method (b) and the AHC method (c).
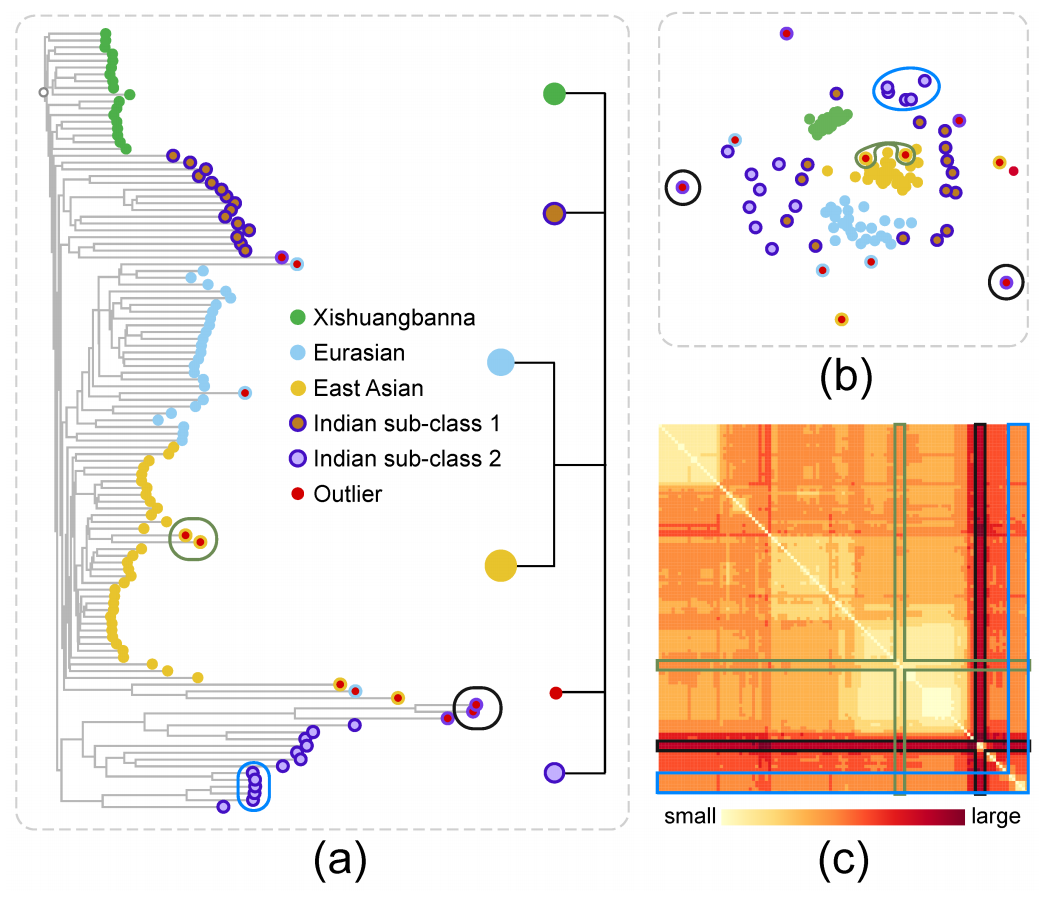
Figure 9: Exploration of the Cucumber data: (a) O3NJ tree and distilled hierarchy; (b) MDS plot; (c) heat map showing the input distance matrix. Three kinds of inconsistencies between our O3NJ tree representation and the MDS results are highlighted by black, green and blue circles in the O3NJ tree, the corresponding nodes are also highlighted in the MDS plot and the heap map. Class label and cluster index of each node are encoded by border and fill color.
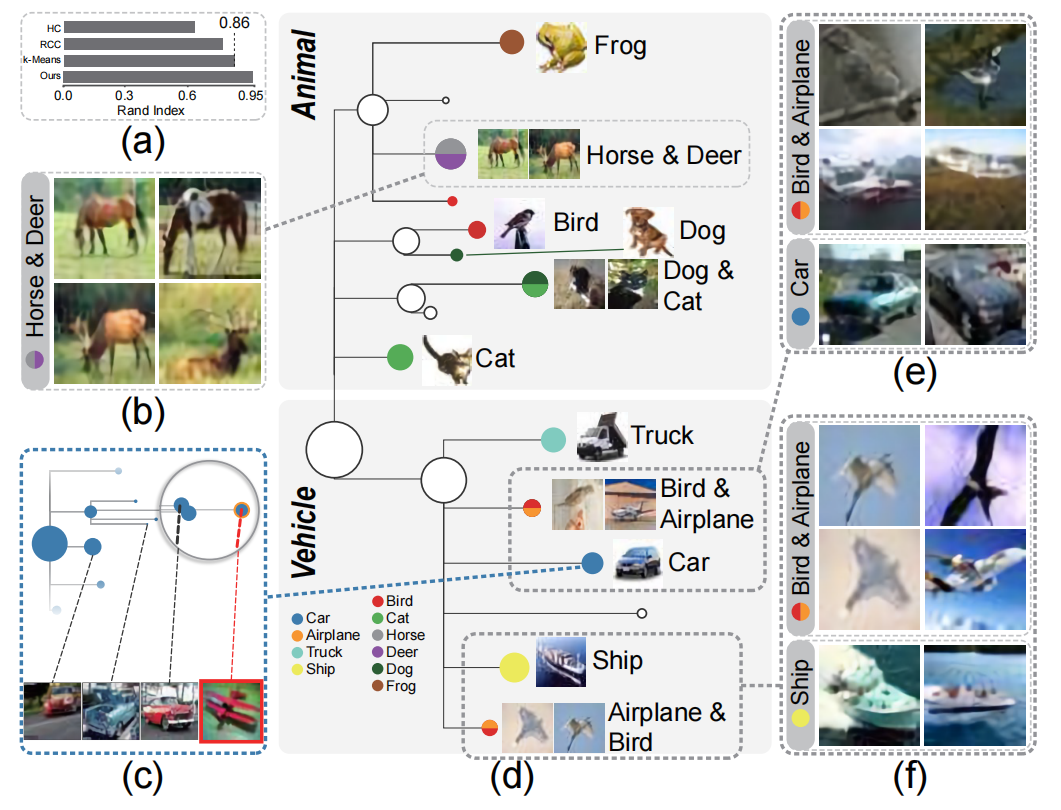
Figure 10: Exploration of the CIFAR-10 image data with our distilled cluster tree: (a) clustering accuracy of several algorithms measured by the Rand Index; (b) four representative images of the cluster consisting of Horse and Deer classes; (c) sub-tree of the Car class shown in the O3NJ tree with images of one outlier and three selected nodes; (d) the distilled cluster tree, where each node is associated with a class label; (e) representative images of two clusters: Bird & Airplane and Car class; (f) representative images of two clusters: Bird & Airplane and Ship class.
Materials:
 |
 |
| Paper | Supp. |
Acknowledgements:
This work was supported by the grants of the National Key R&D Program of China under Grant
2022ZD0160805, in part by NSFC under Grants 62132017 and 62141217, in part by Shandong Provincial
Natural Science Foundation under Grant ZQ2022JQ32, and the Shenzhen Science and Technology Program
(GJHZ20210705141402008), as well as in part by the DFG (German Research Foundation) under Germany’s
Excellence under Grant Strategy-EXC2117-422037984 and in part by the Project-ID 251654672 – TRR 161.