Chart2SVG: Editable SVG Generation from Raster Chart Images
Jinning Cui1
Lu Chen2
Haoyan Shi3
Yue He1
Chenglong Wang4
Mengyu Zhou5
Weidong Huang6 and
Yunhai Wang1
1Renmin University of China
2State Key Lab of CAD&CG, Zhejiang University
3Shandong University
4Microsoft Research
5Qwen Large Model Application Team, Alibaba
6University of Technology Sydney
Accepted by VIS 2026
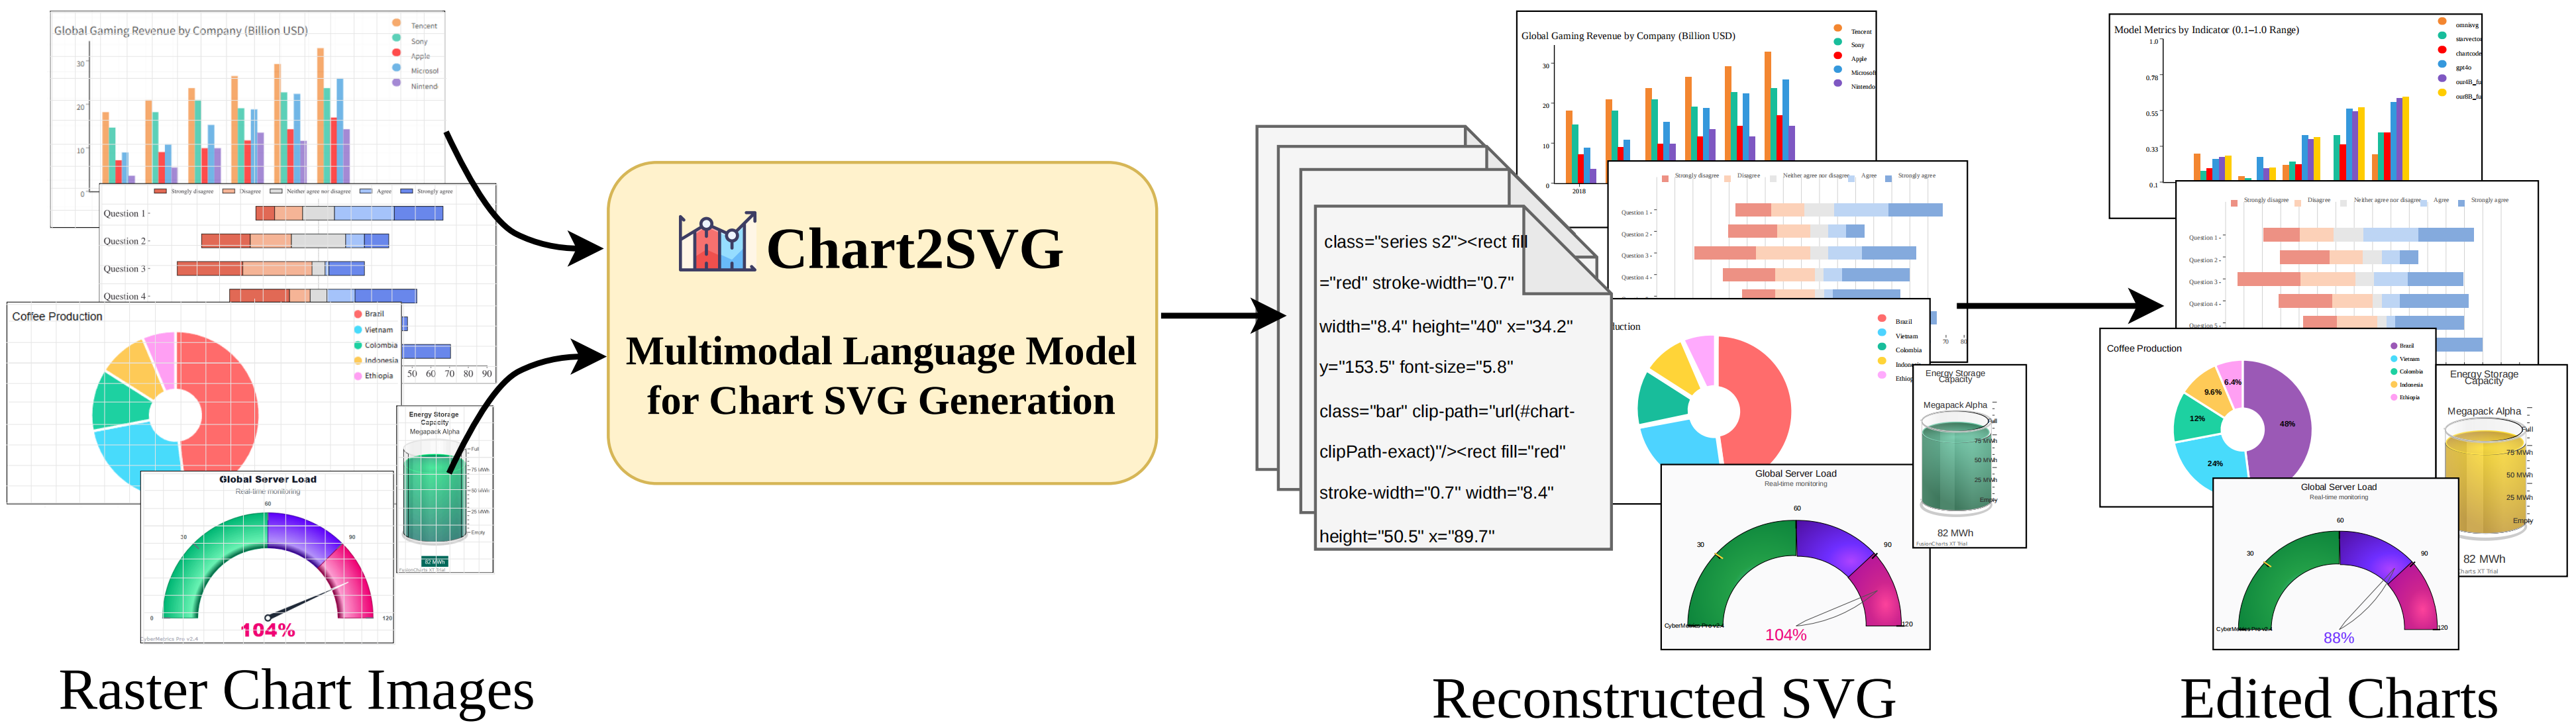
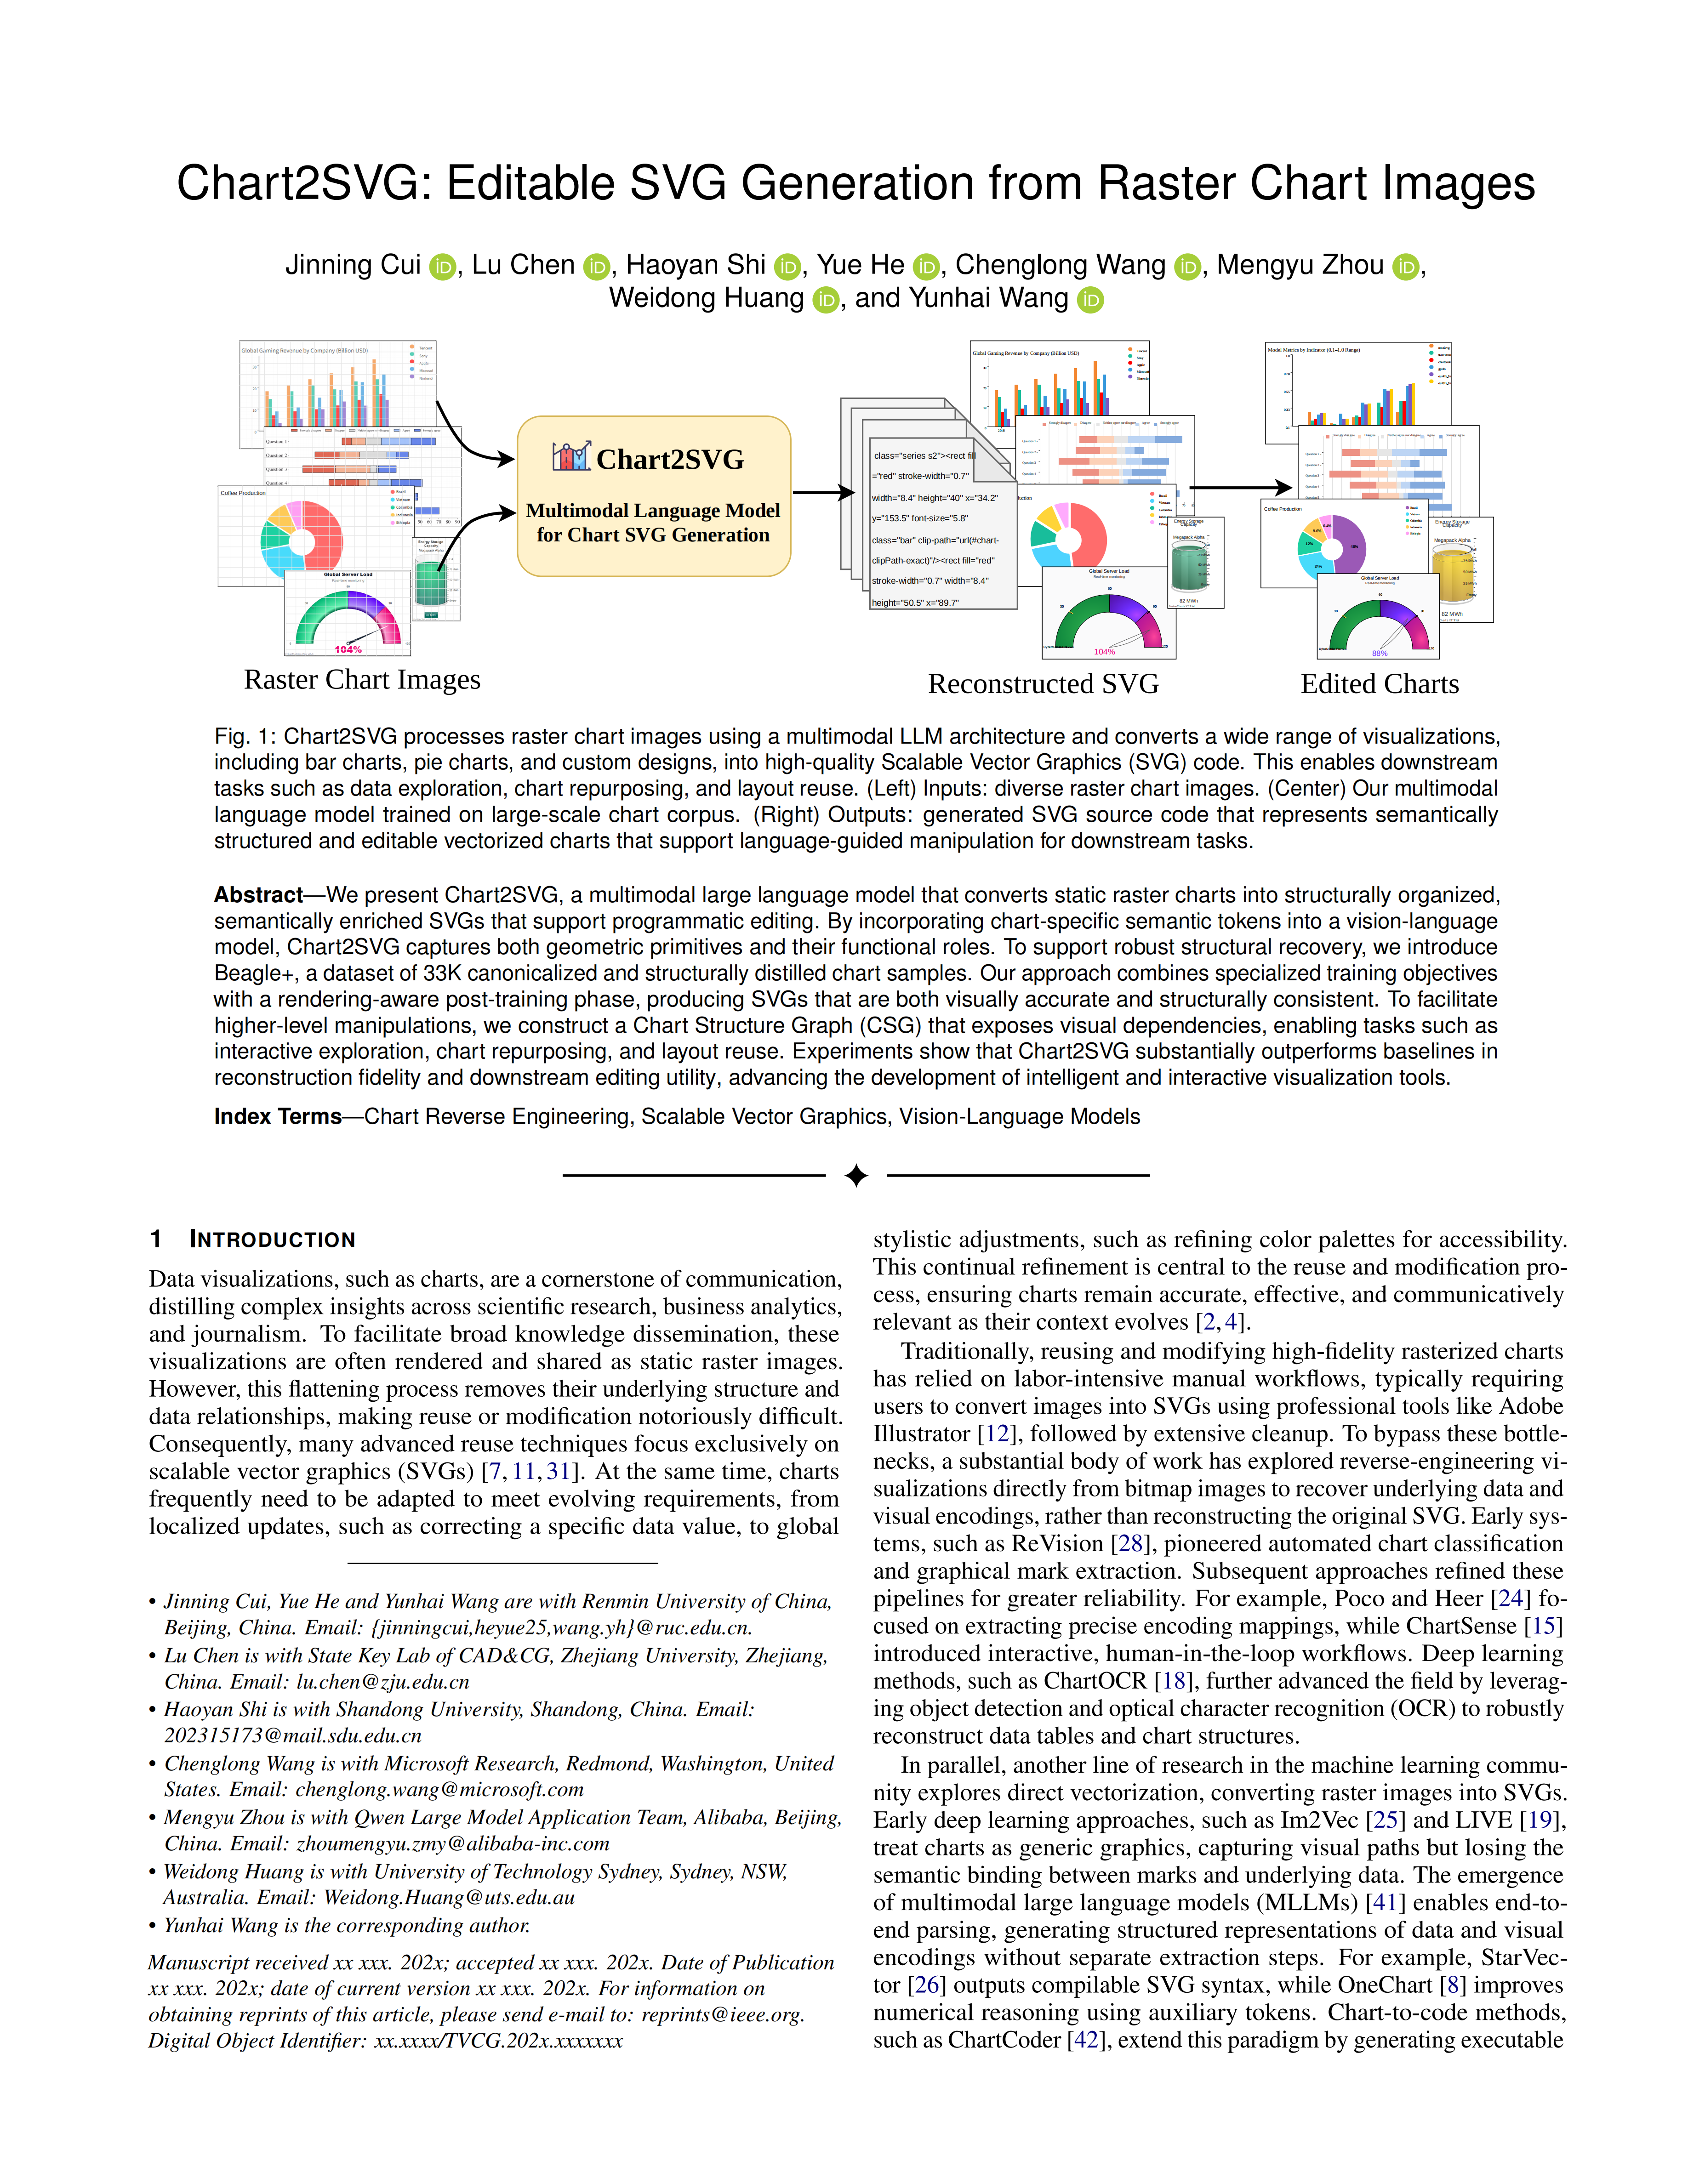
Figure 1: Chart2SVG processes raster chart images using a
multimodal LLM architecture and converts a wide range of visualizations,
including bar charts, pie charts, and custom designs, into high-quality
Scalable Vector Graphics (SVG) code. This enables downstream tasks such
as data exploration, chart repurposing, and layout reuse. (Left) Inputs:
diverse raster chart images. (Center) Our multimodal language model
trained on a large-scale chart corpus. (Right) Outputs: generated SVG
source code representing semantically structured and editable vector
charts that support language-guided manipulation for downstream tasks.
Abstract:
We present Chart2SVG, a multimodal large language model that converts static raster charts into structurally organized, semantically enriched SVGs that support programmatic editing. By incorporating chart-specific semantic tokens into a vision-language model, Chart2SVG captures both geometric primitives and their functional roles. To support robust structural recovery, we introduce Beagle+, a dataset of 33K canonicalized and structurally distilled chart samples. Our approach combines specialized training objectives with a rendering-aware post-training phase, producing SVGs that are both visually accurate and structurally consistent. To facilitate higher-level manipulations, we construct a Chart Structure Graph (CSG) that exposes visual dependencies, enabling tasks such as interactive exploration, chart repurposing, and layout reuse. Experiments show that Chart2SVG substantially outperforms baselines in reconstruction fidelity and downstream editing utility, advancing the development of intelligent and interactive visualization tools.
Figures:
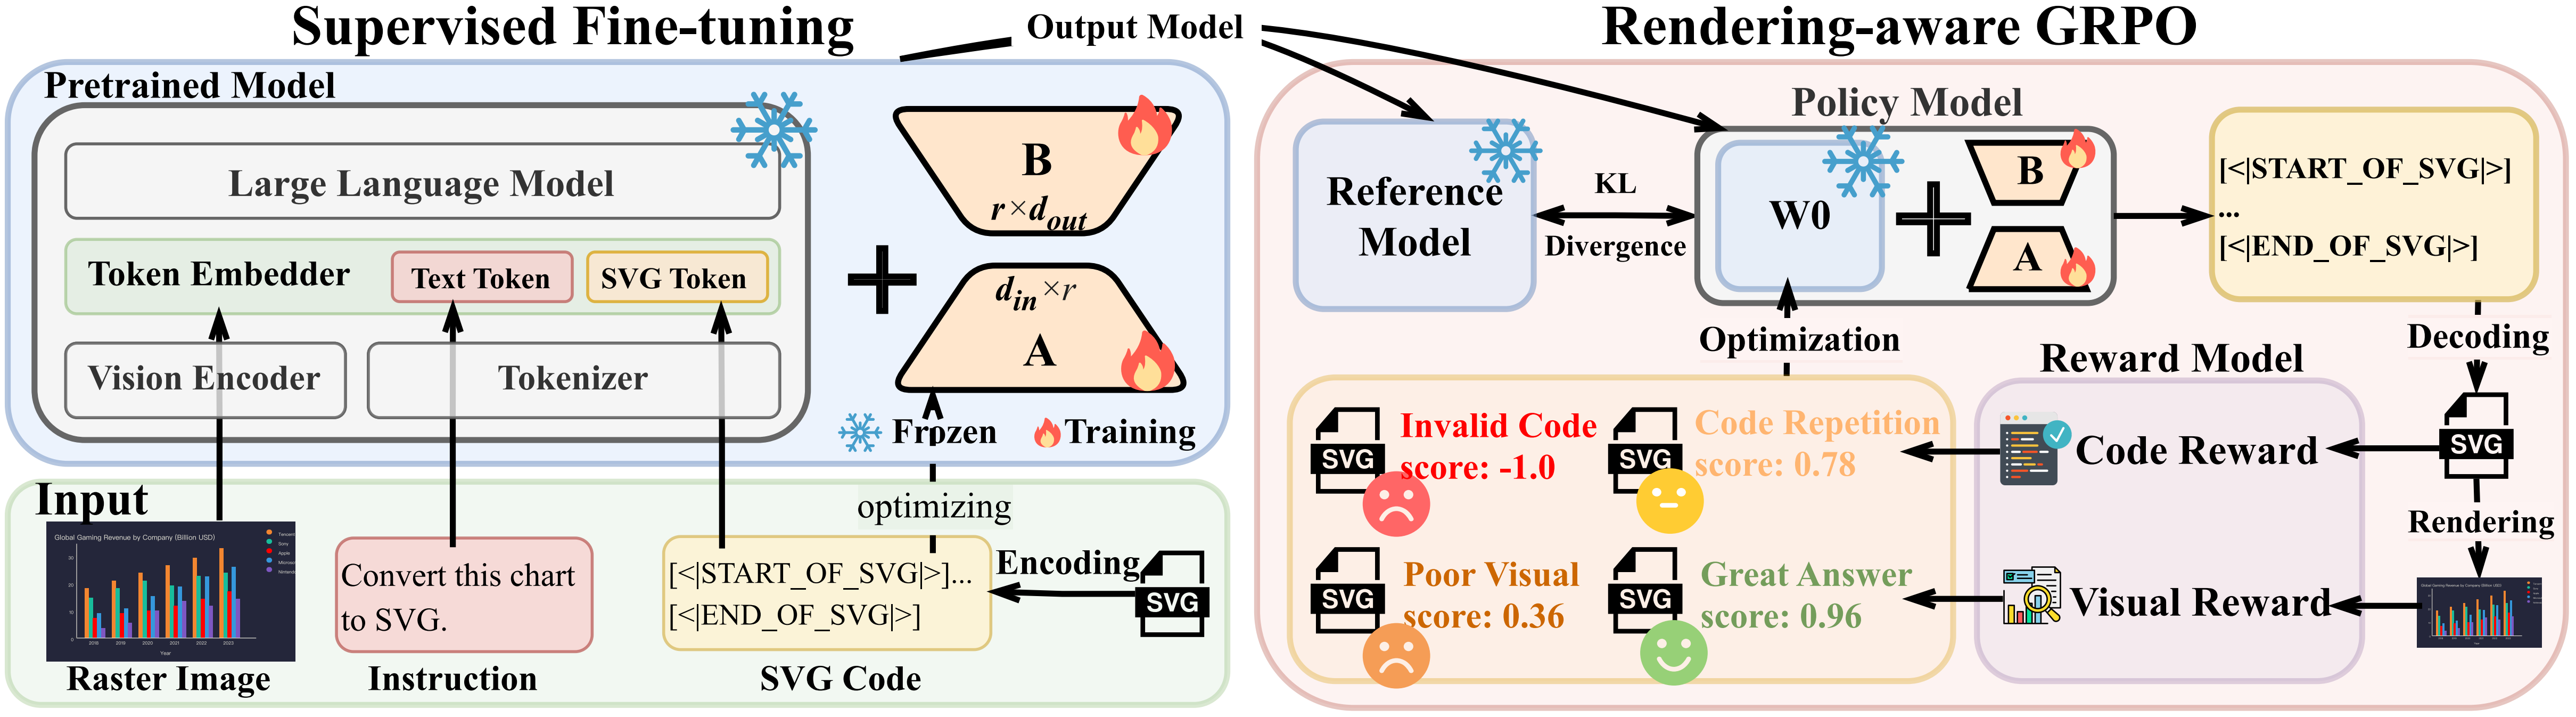
Figure 2: Training pipeline. (Left) SFT: a vision encoder and an LLM are aligned via parameter-efficient adapters to generate structured SVG sequences. (Right) Rendering-aware GRPO: SVG candidates are evaluated using rewards for code validity and visual fidelity, with KL divergence from a reference model used for regularization.
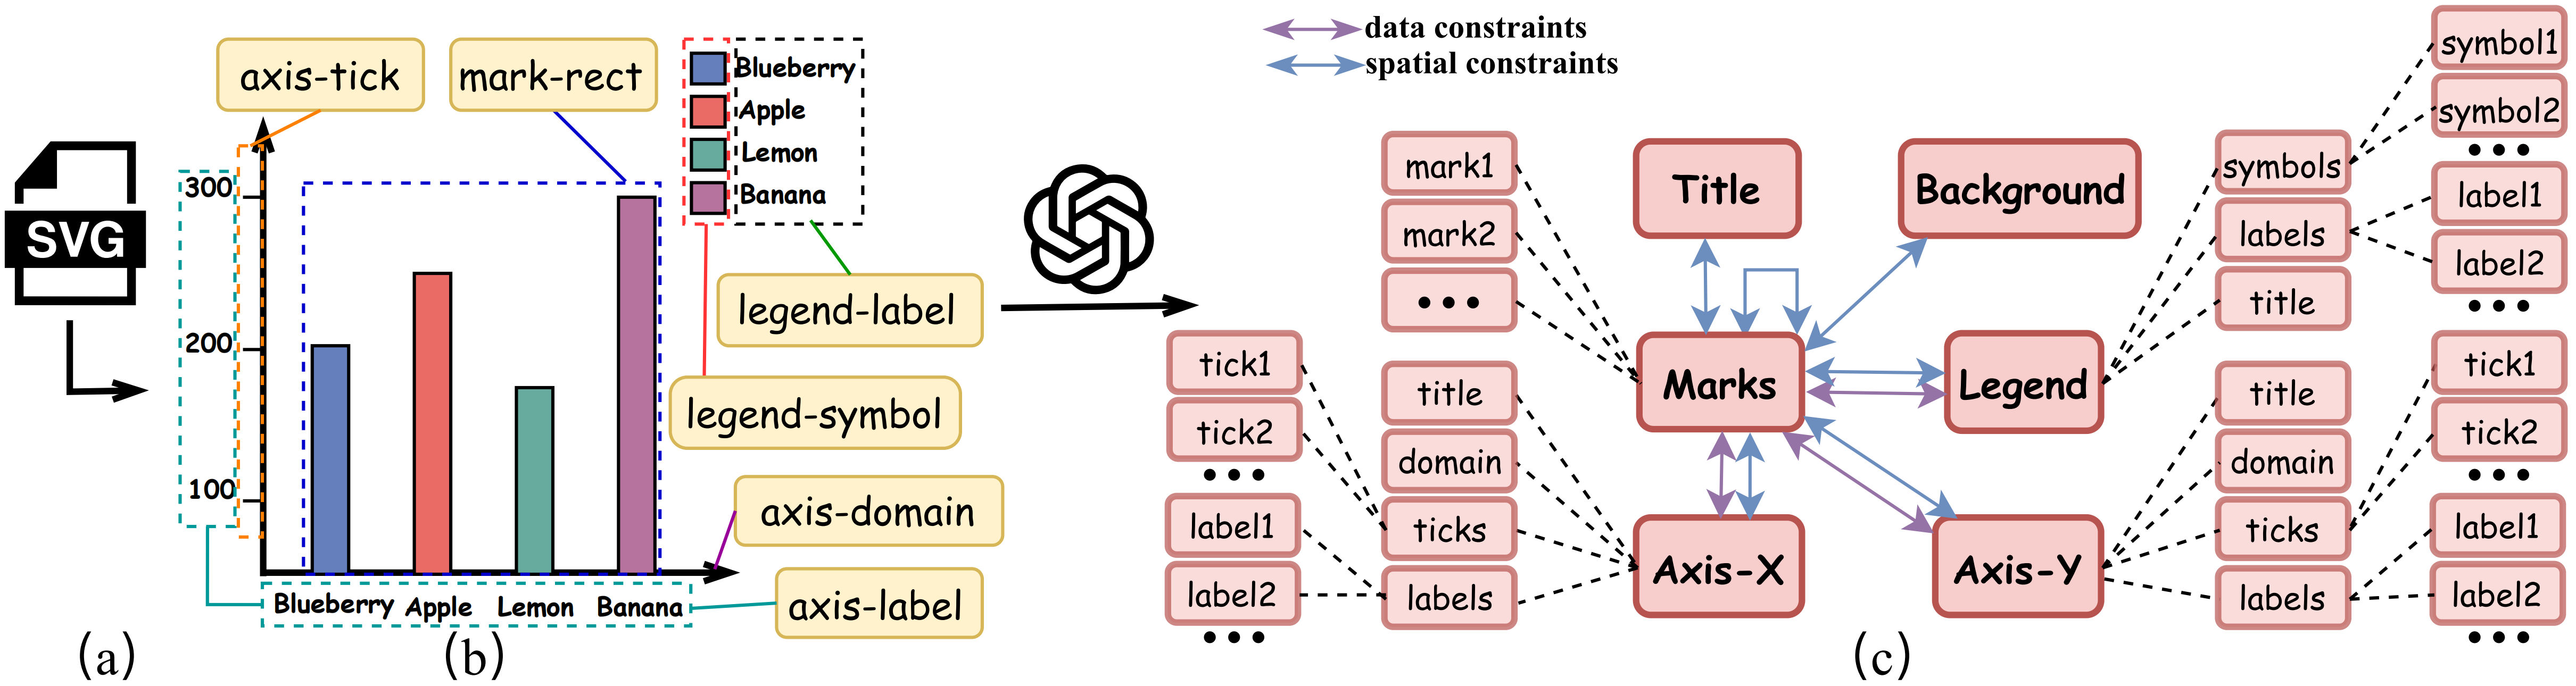
Figure 3: CSG construction pipeline. Starting from a reconstructed SVG (a), chart components are extracted (b) and organized into a graph (c) with data constraints governing mark–axis–legend relationships and spatial constraints defining the layout relative to the marks.
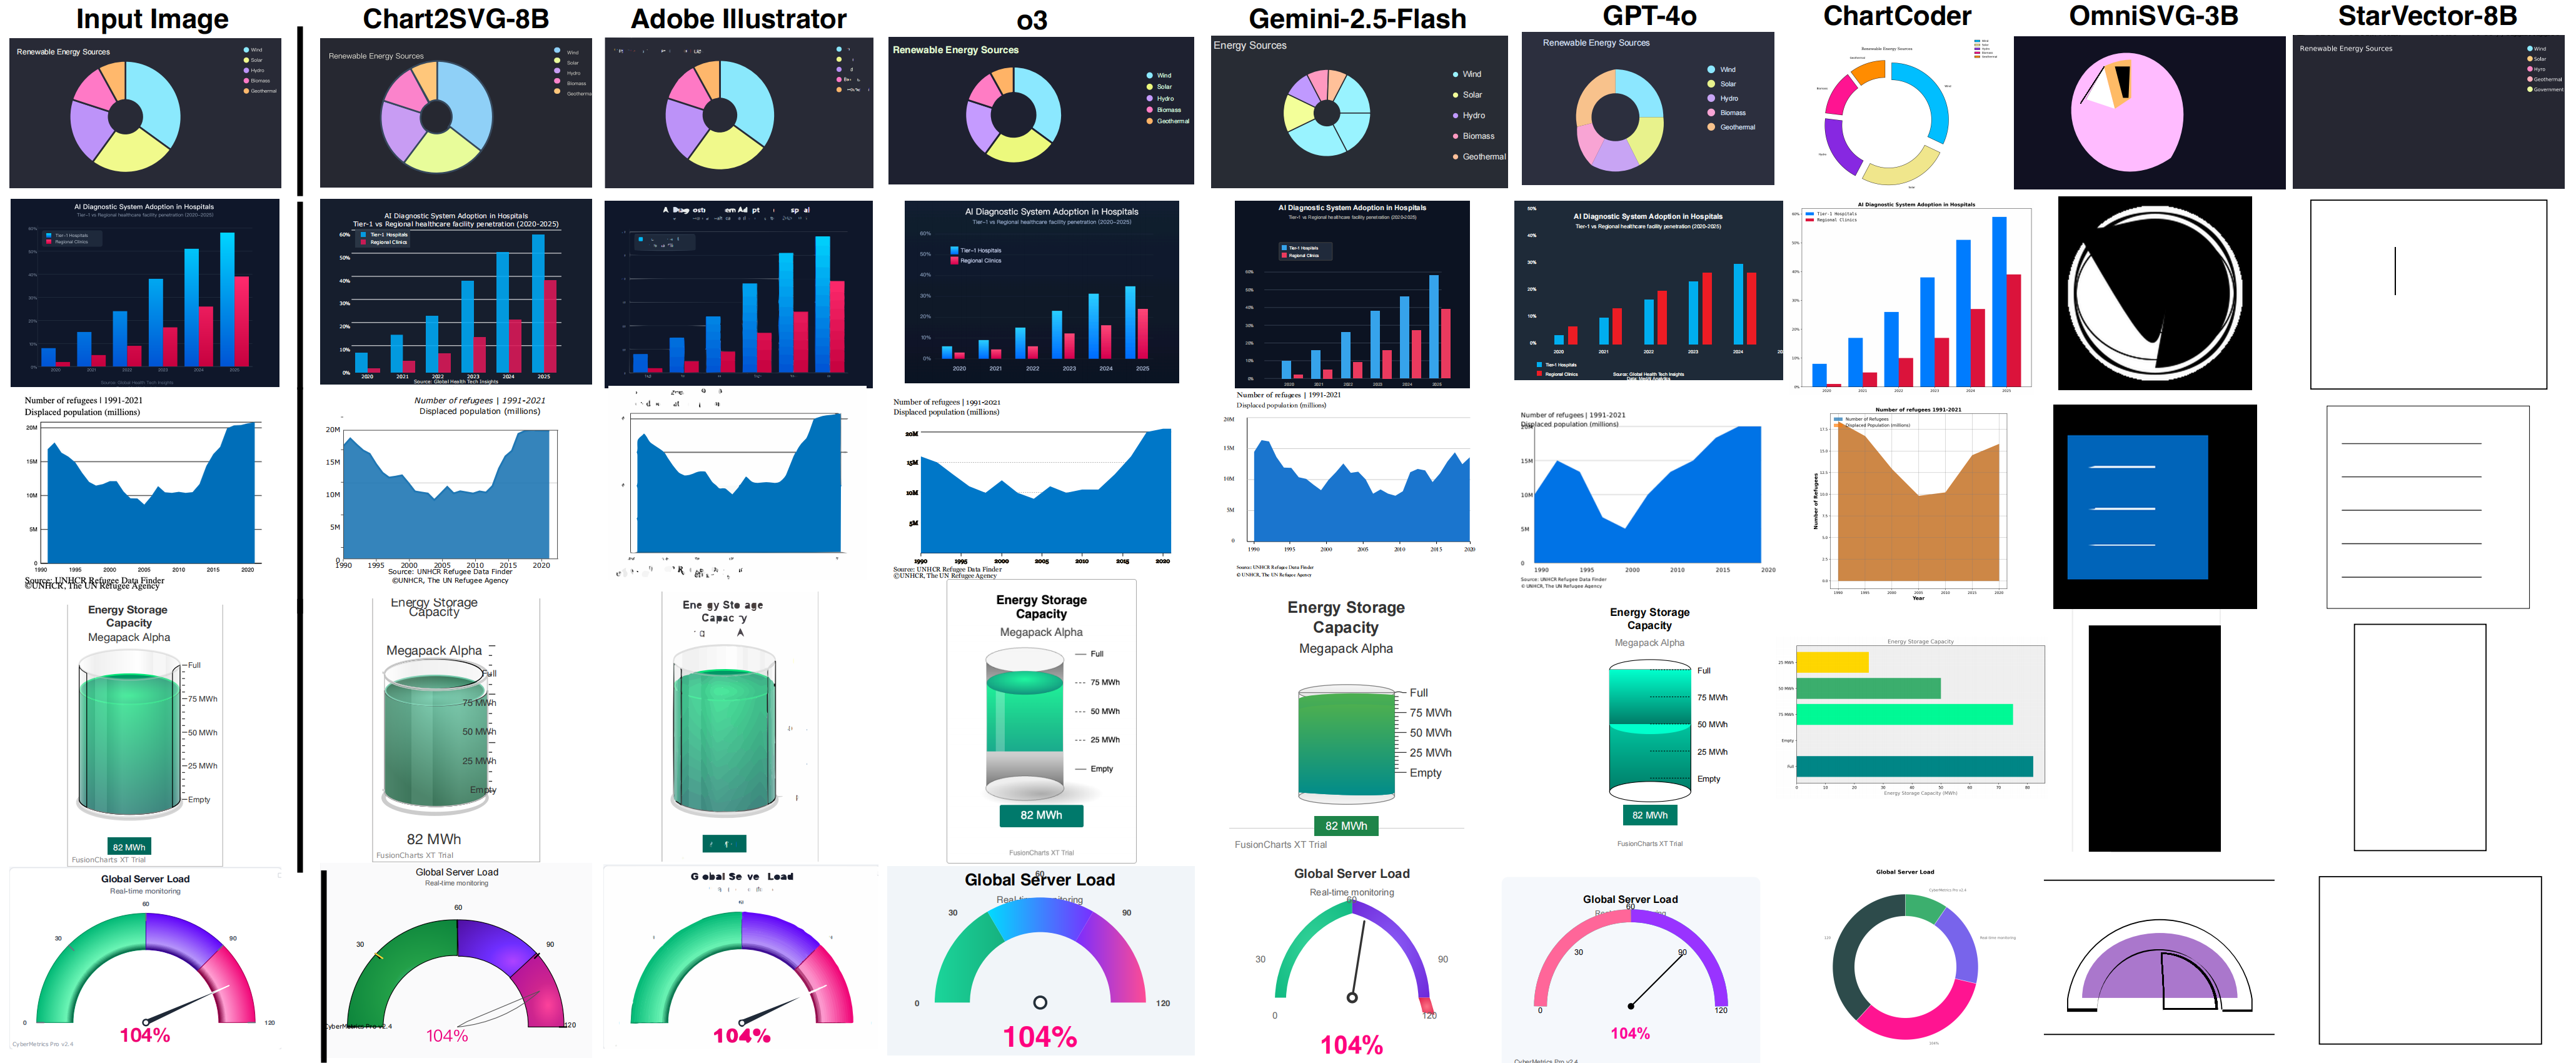
Figure 4: Qualitative comparison of our model with general-purpose and state-of-the-art chart- and SVG-oriented foundation MLLMs for chart vectorization.
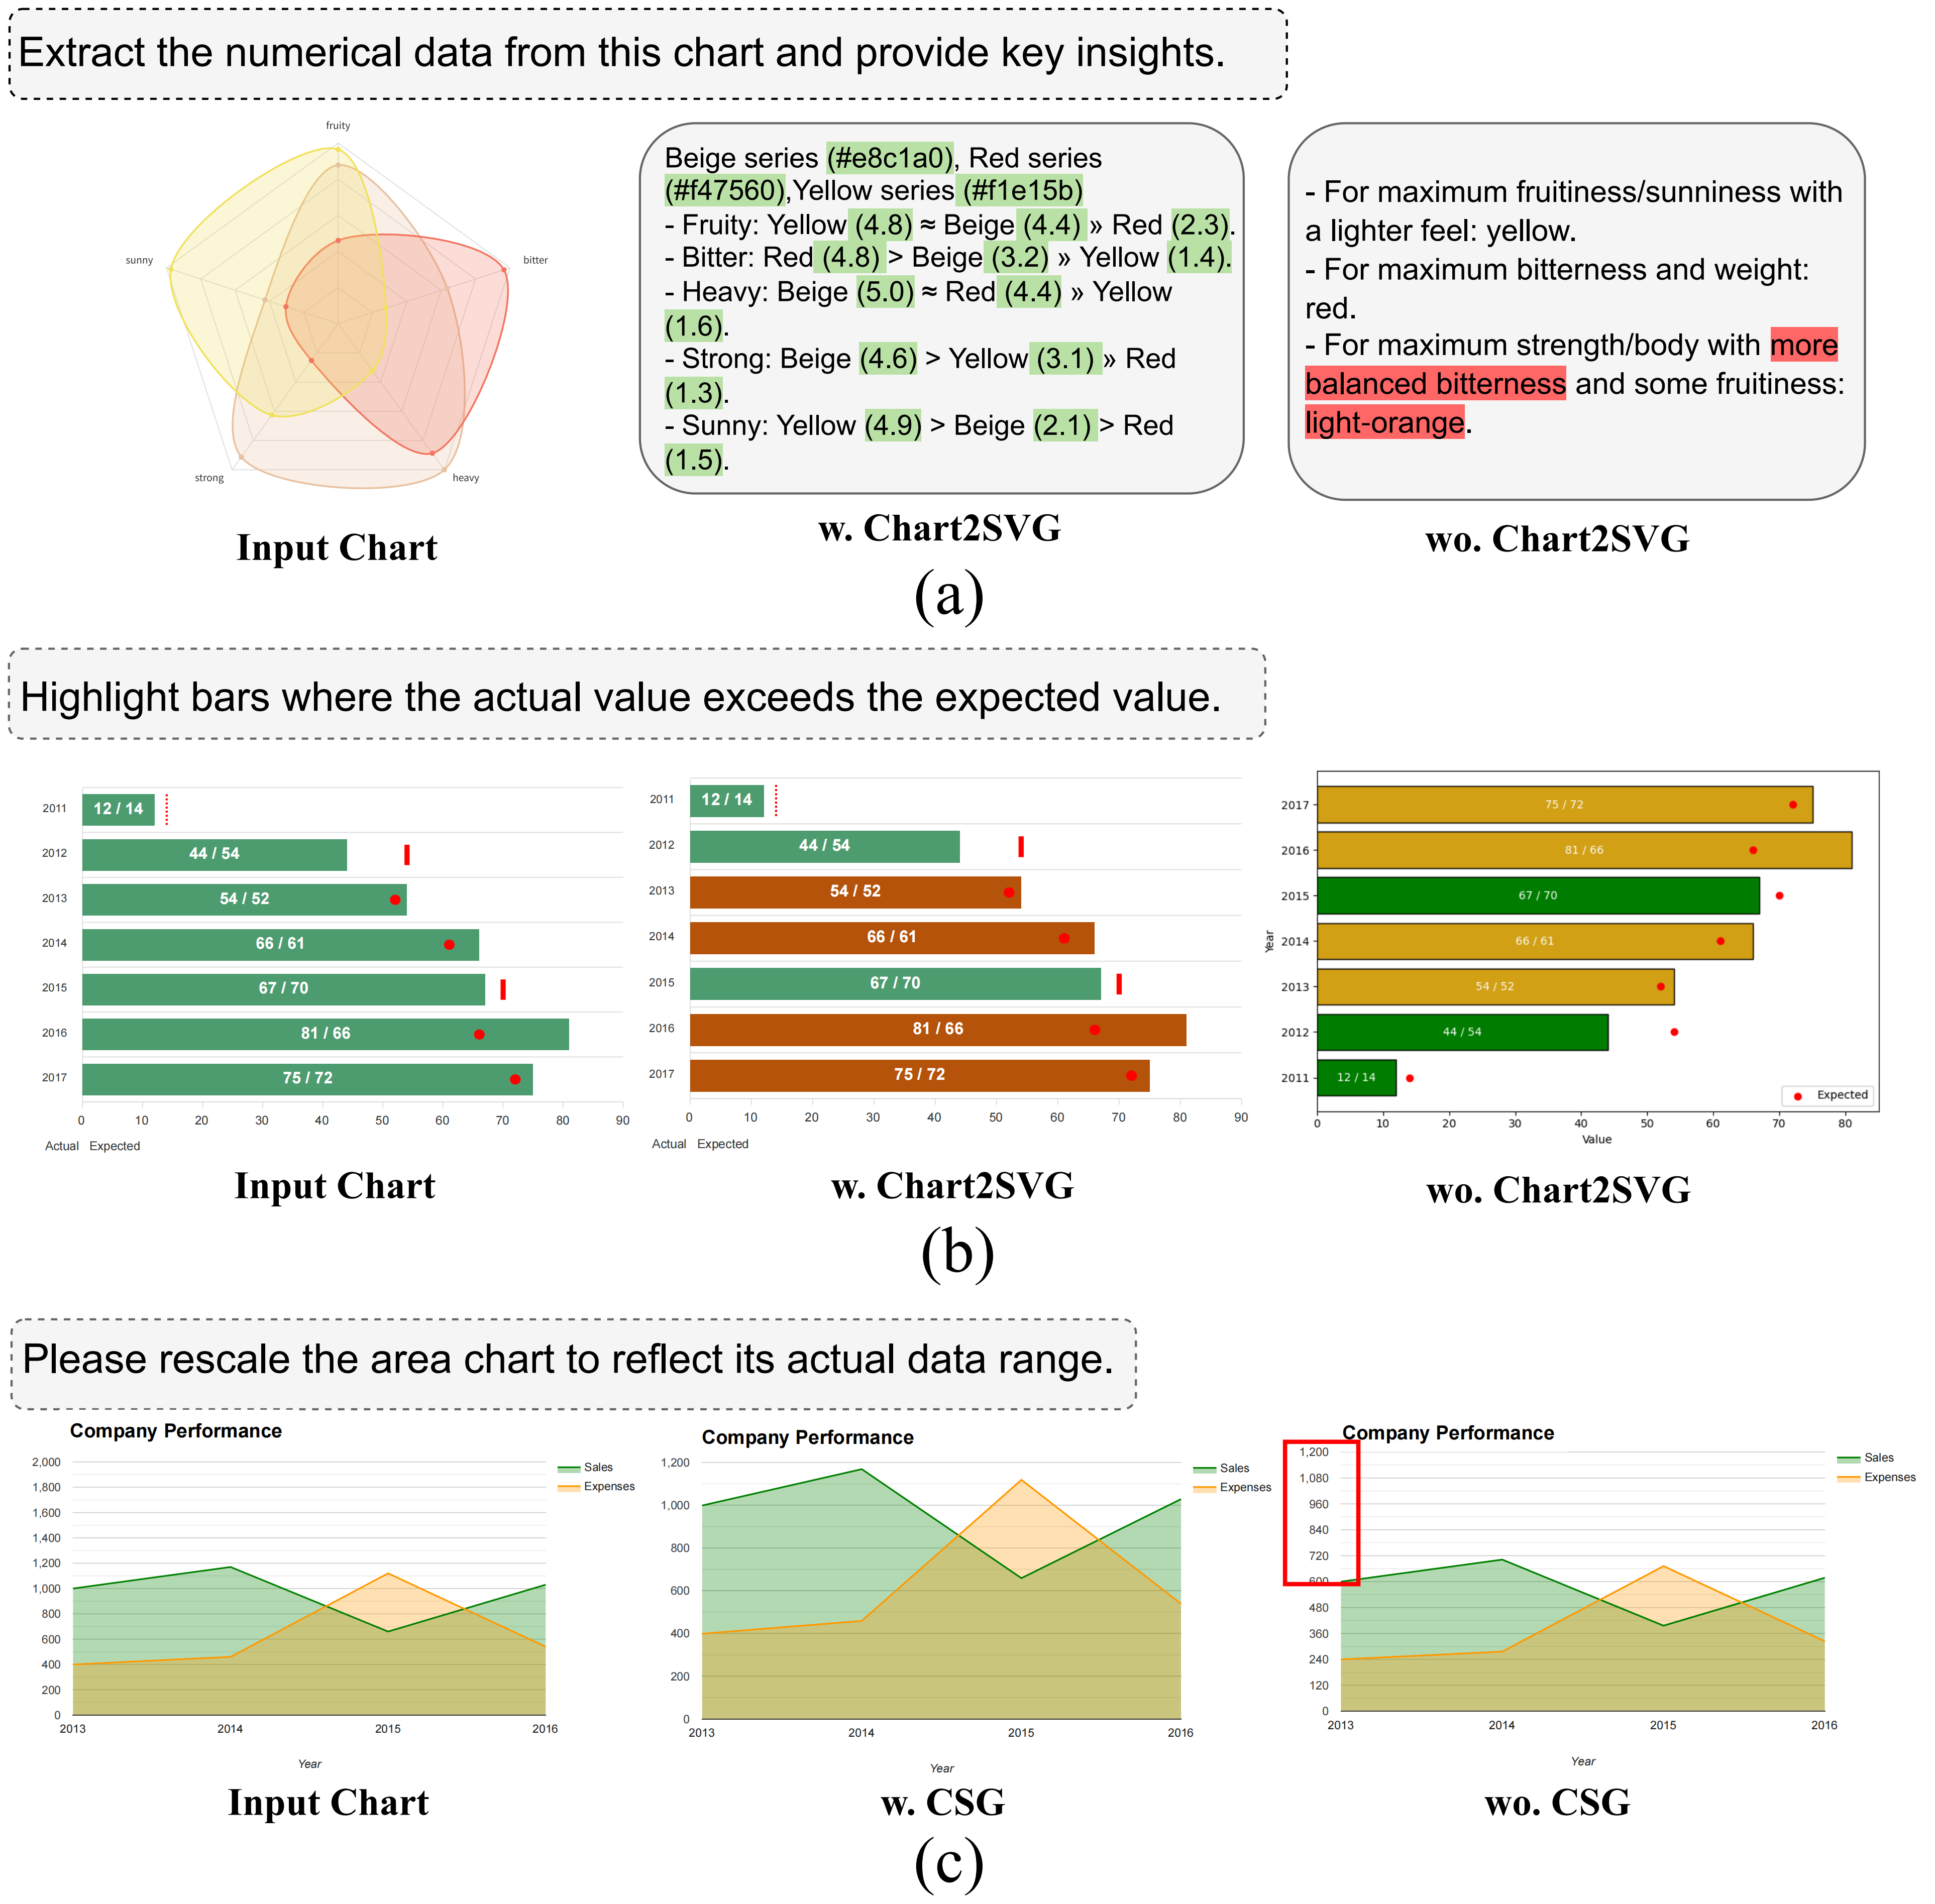
Figure 5: Interactive chart exploration. (a) Data extraction: Chart2SVG enables precise value recovery, whereas the baseline hallucinates value ranges. (b) Semantic querying: Chart2SVG correctly highlights the requested marks, whereas the baseline misidentifies them. (c) Rescaling: the CSG updates geometric paths, whereas the baseline modifies only the text labels.
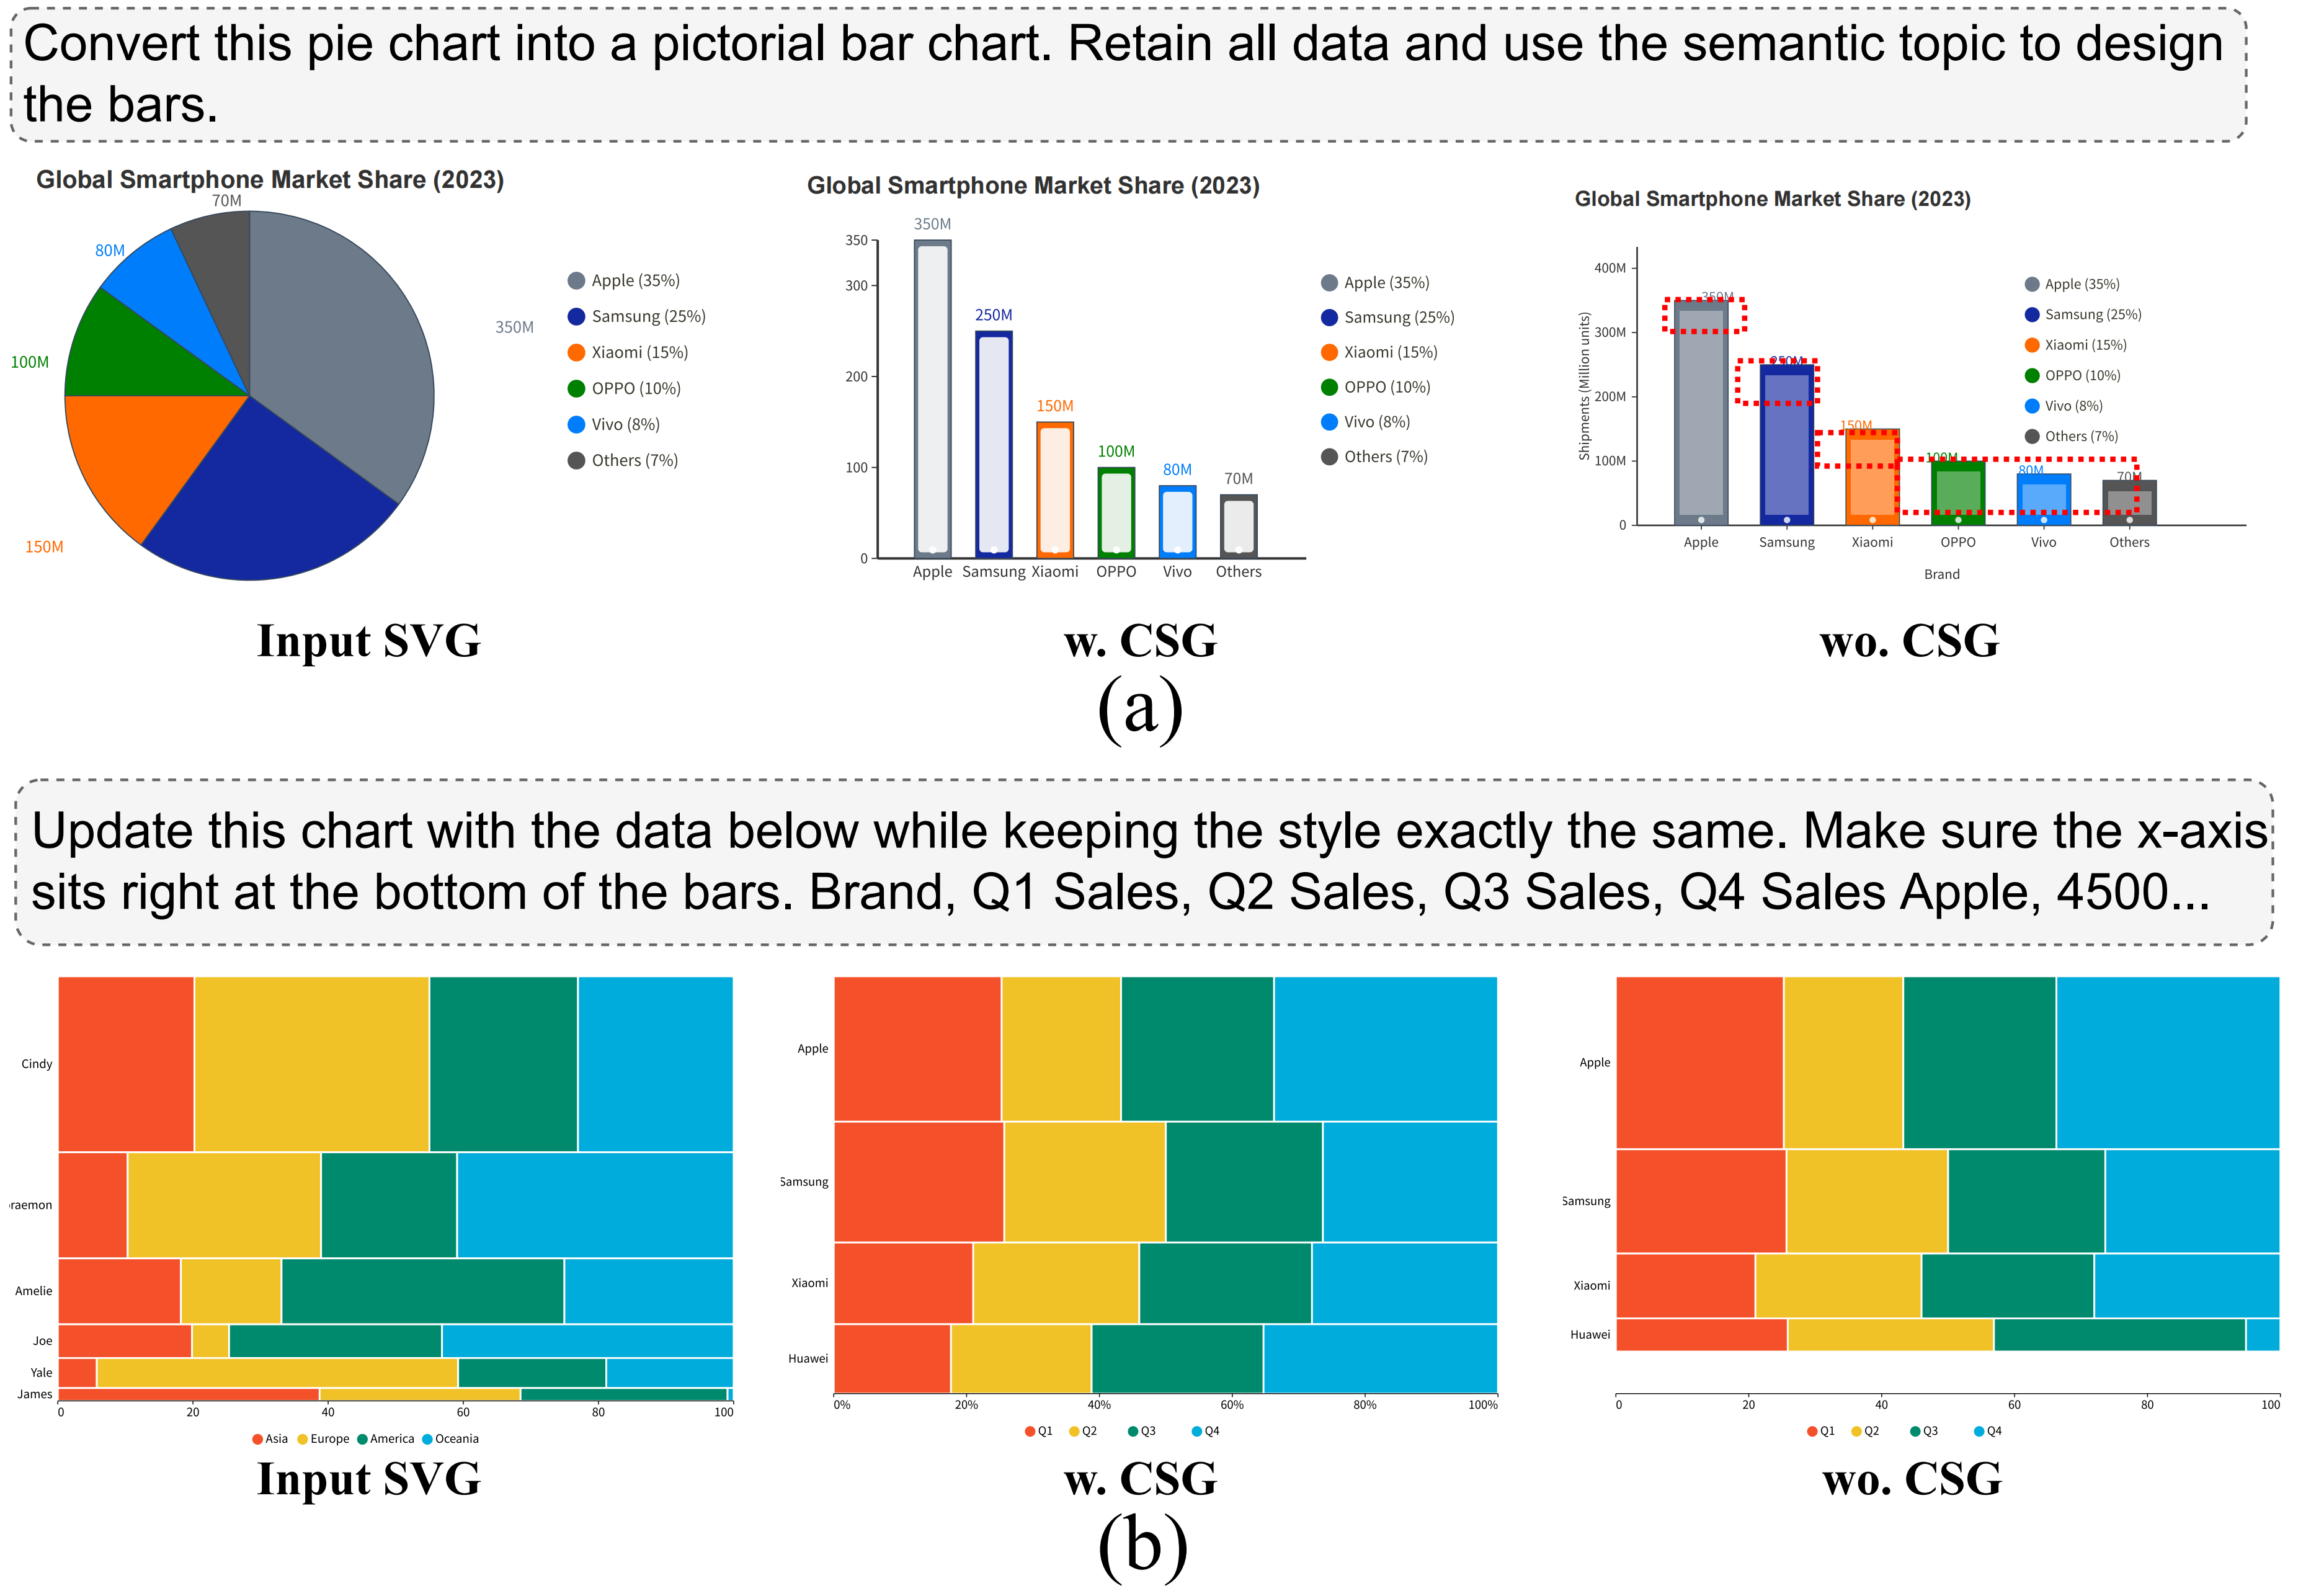
Figure 6: Chart repurposing (a) and layout reuse (b). (a) The CSG enables pie-to-pictorial-bar conversion, whereas the baseline hallucinates data (red). (b) The CSG preserves x-axis alignment when applied to new data, whereas the baseline fails.
Materials:
|
|
| Paper (PDF) | Supplemental Material (PDF) |
Acknowledgements:
We sincerely thank Xuan Hua and Hewen Zhang for their experiments and data generation support. This work is supported by the grants of the NSFC (No.62402284,
No.U2436209), the Beijing Natural Science Foundation (L247027), NSF of
Shandong province (ZR2024QF212), the Fundamental Research Funds for
the Central Universities, and the Research Funds of Renmin University
of China.