Libra+: Compositional Interaction for Data Visualization
Xu Luo1
Yue Zhao2
Bongshin Lee3
Jean-Daniel Fekete4
Yunhai Wang1
1Renmin University of China, Beijing, China
2Shandong Second Medical University, Weifang, Shandong,
China
3Yonsei University, Seoul, Republic of Korea
4Inria and Universite Paris-Saclay
Accepted by VIS 2026
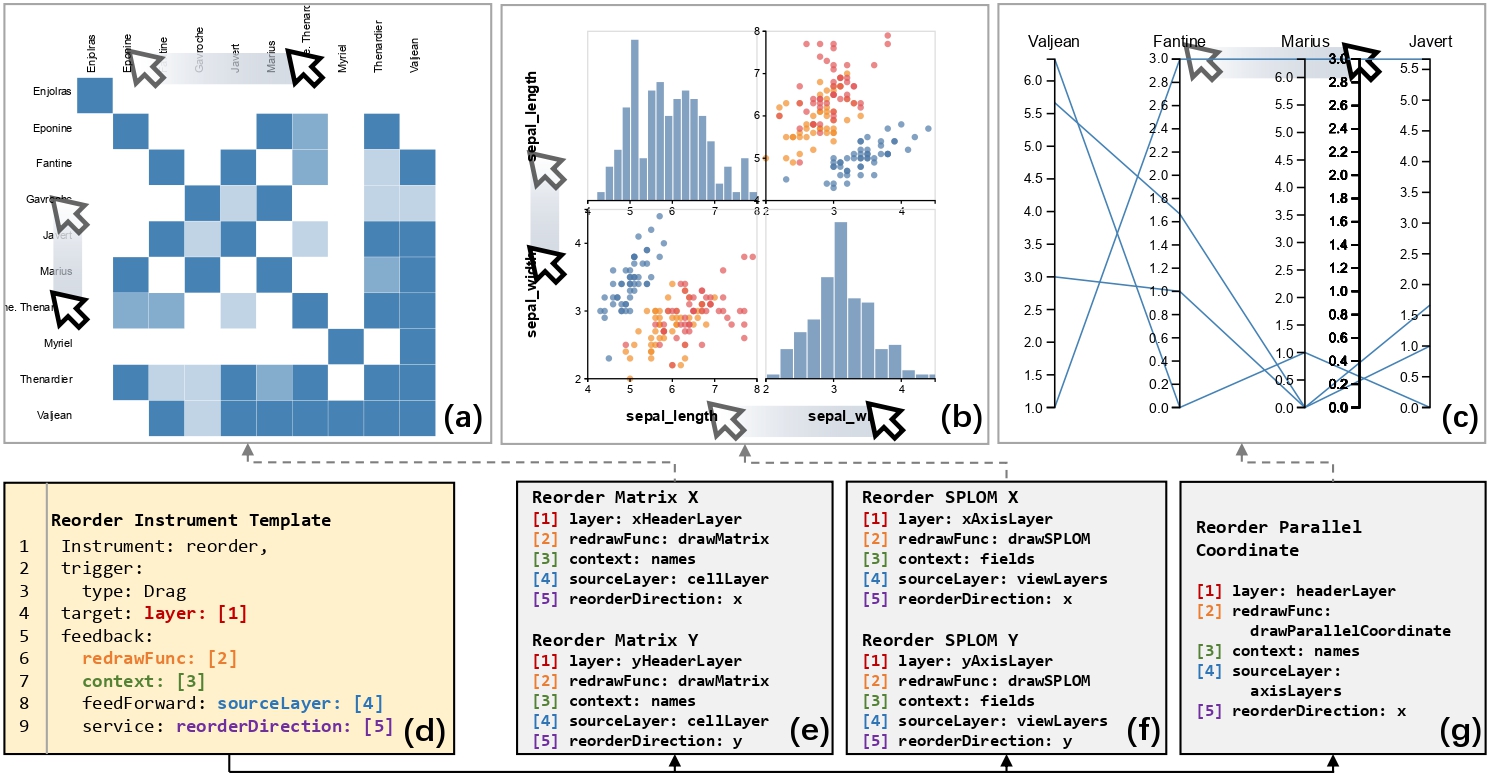
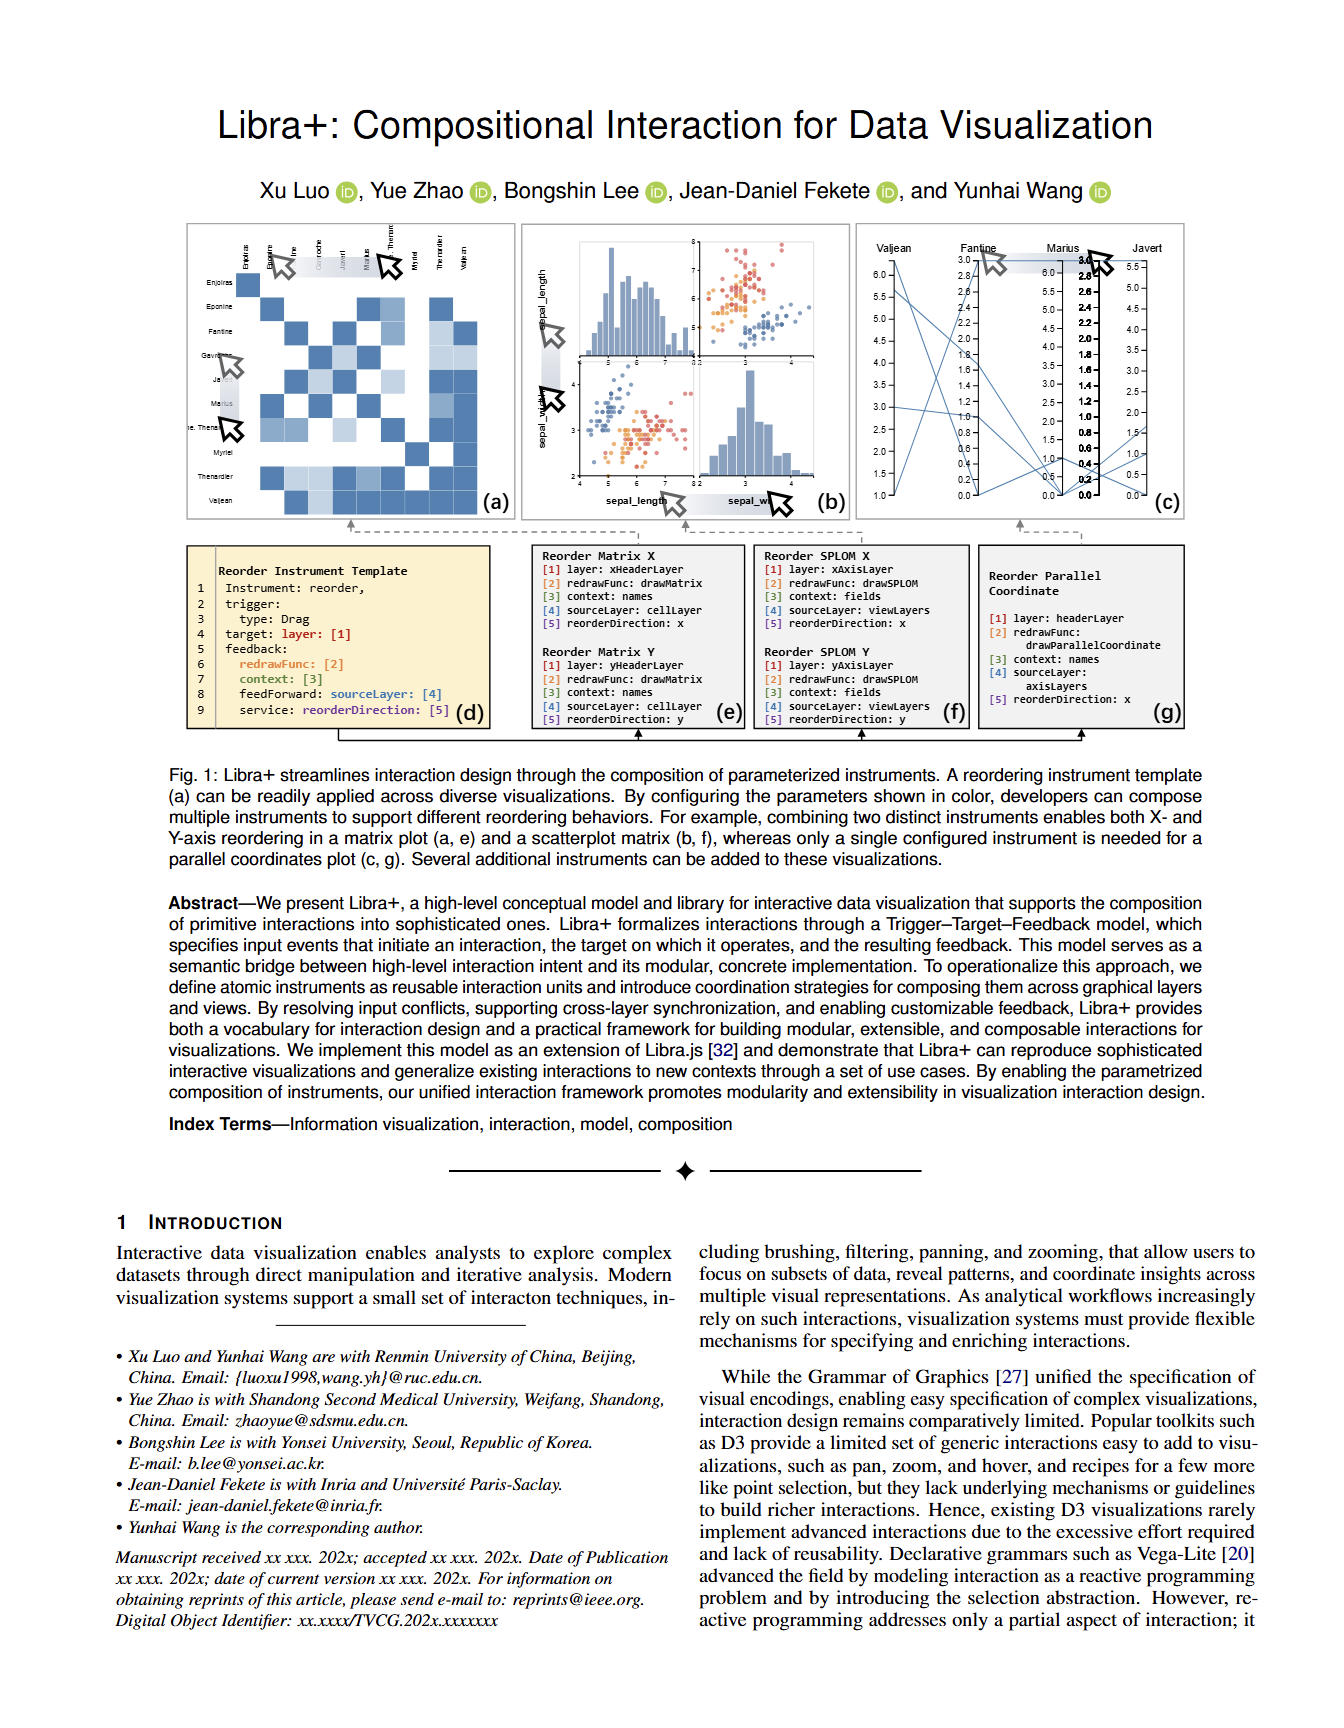
Figure 1: Libra+ streamlines interaction design through the composition of parameterized instruments. A reordering instrument template
(a) can be readily applied across diverse visualizations. By configuring the parameters shown in color, developers can compose
multiple instruments to support different reordering behaviors. For example, combining two distinct instruments enables both X- and
Y-axis reordering in a matrix plot (a, e) and a scatterplot matrix (b, f), whereas only a single configured instrument is needed for a
parallel coordinates plot (c, g). Several additional instruments can be added to these visualizations.
Abstract:
We present Libra+, a high-level conceptual model and library for interactive data visualization that supports the composition of primitive interactions into sophisticated ones. Libra+ formalizes interactions through a Trigger–Target–Feedback model, which specifies input events that initiate an interaction, the target on which it operates, and the resulting feedback. This model serves as a semantic bridge between high-level interaction intent and its modular, concrete implementation. To operationalize this approach, we define atomic instruments as reusable interaction units and introduce coordination strategies for composing them across graphical layers and views. By resolving input conflicts, supporting cross-layer synchronization, and enabling customizable feedback, Libra+ provides both a vocabulary for interaction design and a practical framework for building modular, extensible, and composable interactions for visualizations. We implement this model as an extension of Libra.js [32] and demonstrate that Libra+ can reproduce sophisticated interactive visualizations and generalize existing interactions to new contexts through a set of use cases. By enabling the parametrized composition of instruments, our unified interaction framework promotes modularity and extensibility in visualization interaction design.
Source Code & Online Demo: https://libra-plus.github.io/
Figures:

Figure 2: pecifying a multi-functional brushing interaction on a scatterplot by composing a group selection instrument with move and zoom instruments. A base group selection instrument (a) creates the brush, while a rearrangement instrument (b, move) and a navigation instrument (c, zoom) are applied to the transient layer to enable translation and resizing.
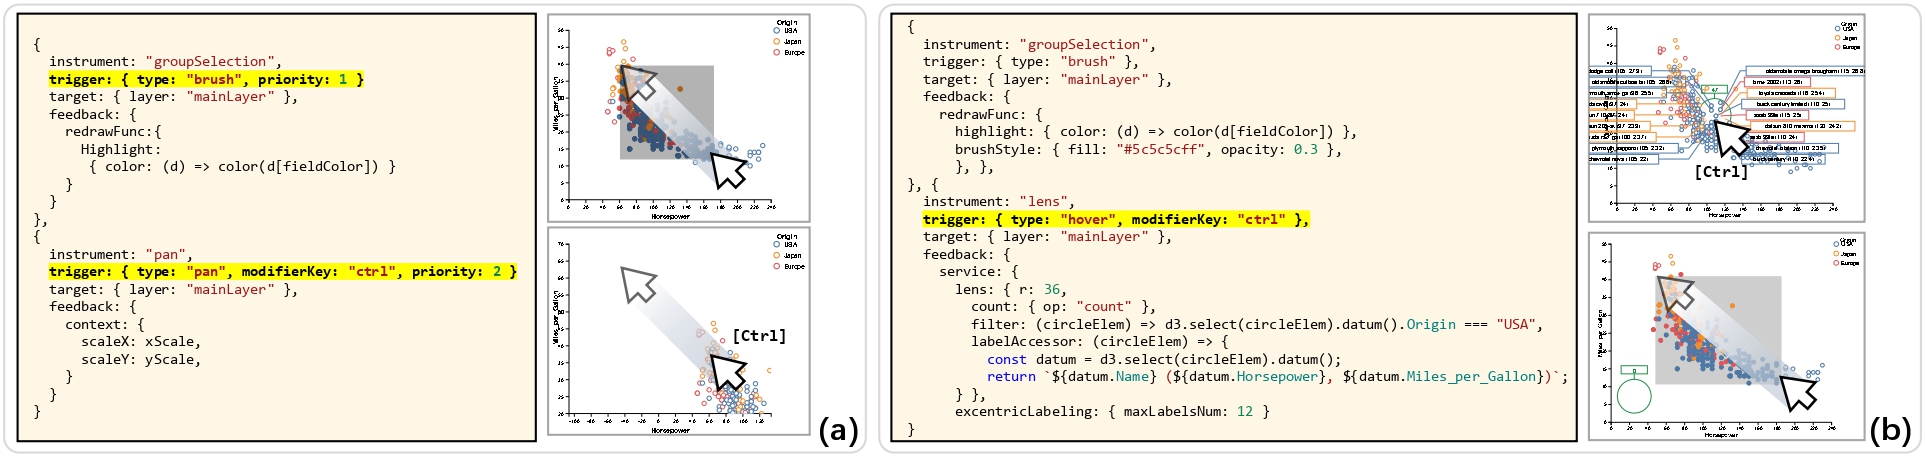
Figure 3: Examples of resolving interaction conflicts. (a) Using the priority and modifierKey properties to resolve a trigger and target conflict between brushing and panning. (b) Utilizing modifier separation to resolve feedback occlusion, explicitly tying the lens instrument to the Ctrl key so it does not interfere with the active brush.
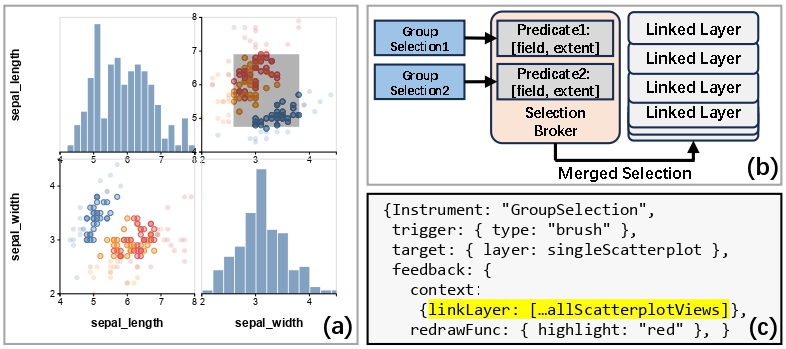
Figure 4: Coordinating cross-filtering using a publish-subscribe mechanism. (a) Linked brushing applied across a scatterplot matrix. (b) Interaction instruments act as independent publishers, sending selection predicates to a central Selection Broker. The broker merges these states and broadcasts the final selection to all subscribed linked layers. (c) This many-to-many coordination is achieved declaratively by simply pass- ing [...allScatterplotViews] to the linkLayer property in the instru- ment’s feedback context.
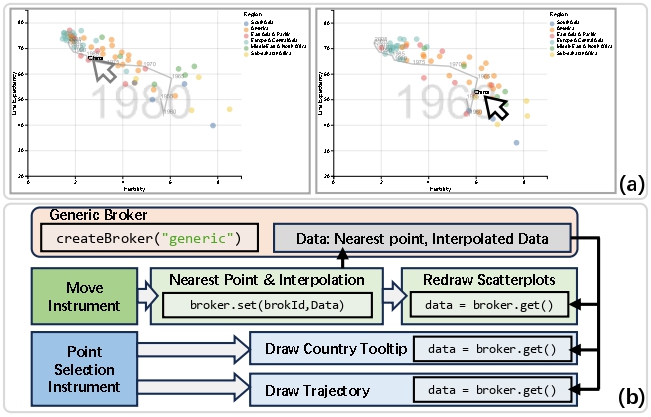
Figure 5: Constructing the DimpVis interaction in Libra+.js. (a) Direct manipulation of a data point’s trajectory triggers global temporal updates. (b) The underlying interaction composition resolving cross-instrument coordination. The custom feedback flows of the MoveInstrument and PointSelectionInstrument interact seamlessly via a shared generic broker. (Block arrows: control flow; Solid black arrows: data flow)
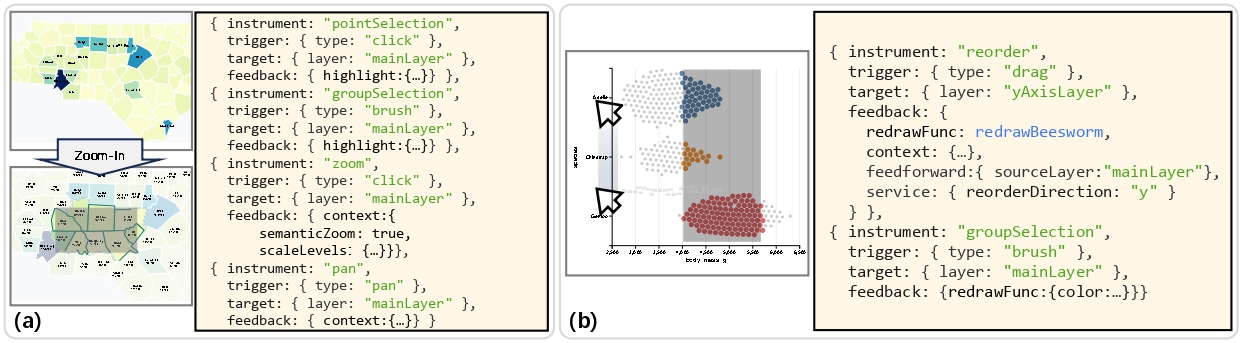
Figure 6: Generalizing Libra+ instruments across visualization contexts: (a) a choropleth map demonstrating the composition of semantic zooming, panning, and selection; (b) a beeswarm plot illustrating custom axis reordering through drag interactions and group selection via brushing.
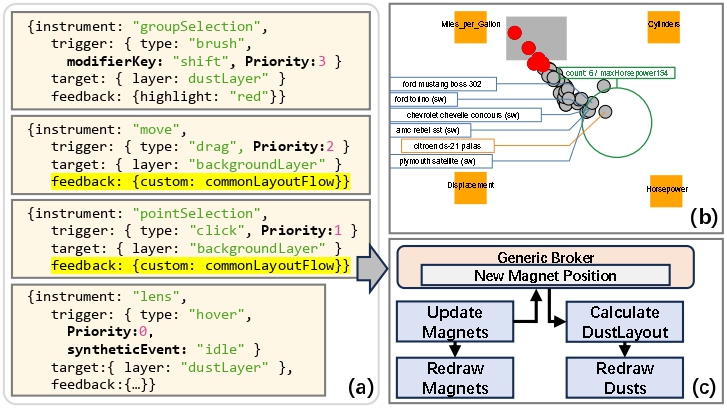
Figure 7: Implementing an enhanced Dust-and-Magnet visualization with excentric labeling in Libra+ by composing multiple distinct instruments into a unified custom feedback flow via centralized broker coordination.
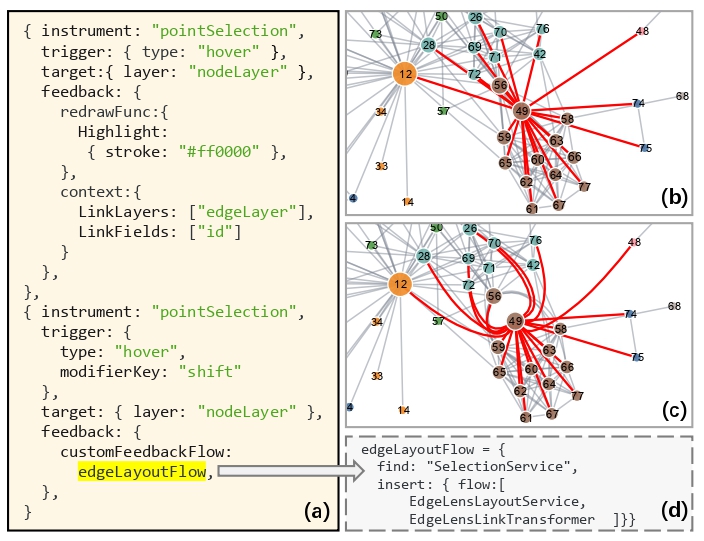
Figure 8: Structural enrichment of neighboring edge highlighting. The system seamlessly stacks a EdgeLens instrument (a) onto the pointSelection instrument. Utilizing a custom feedback flow (d), the instrument bends overlapping edges (c) upon a Shift key press, cleanly resolving the visual clutter typical of standard highlighting (b).
Materials:
|
| Paper (PDF) |
Acknowledgements:
This work is supported by the grants of the NSFC (No.U2436209),
the Beijing Natural Science Foundation (L247027), the Fundamental
Research Funds for the Central Universities, andthe Research Funds of
Renmin University of China.