spEuler: Semantics-preserving Euler Diagrams
(Proceedings of IEEE VIS 2021)
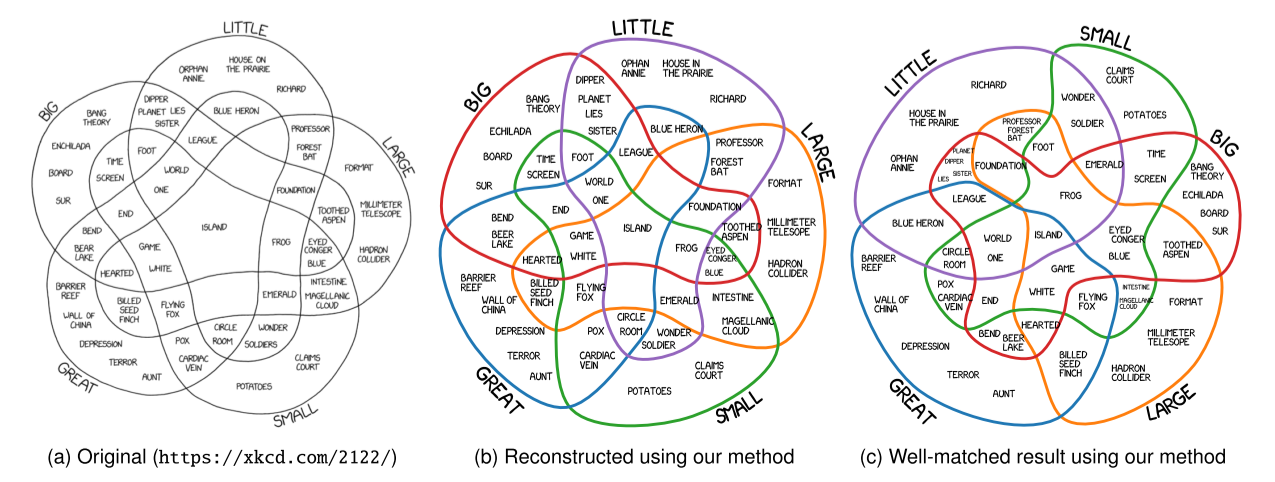
Figure 1: Venn diagrams are often used to highlight complex interactions of sets. This example from xkcd.com shows which adjectives can be used in combination (a). Using our method, we can recreate this manually created Venn diagram (b). Here, the diagram contains empty intersection. In these cases, Euler diagrams (c) provide a more faithful representation of the data.
Abstract:
Creating comprehensible visualizations of highly overlapping set-typed data is a challenging task due to its complexity. To facilitate insights into set connectivity and to leverage semantic relations between intersections, we propose a fast two-step layout technique for Euler diagrams that are both well-matched and well-formed. Our method conforms to established form guidelines for Euler diagrams regarding semantics, aesthetics, and readability. First, we establish an initial ordering of the data, which we then use to incrementally create a planar, connected, and monotone dual graph representation. In the next step, the graph is transformed into a circular layout that maintains the semantics and yields simple Euler diagrams with smooth curves. When the data cannot be represented by simple diagrams, our algorithm always falls back to a solution that is not well-formed but still well-matched, whereas previous methods often fail to produce expected results. We show the usefulness of our method for visualizing set-typed data using examples from text analysis and infographics. Furthermore, we discuss the characteristics of our approach and evaluate our method against state-of-the-art methods.
Materials:
Paper: [PDF 3M].
Supp: .
Overview:
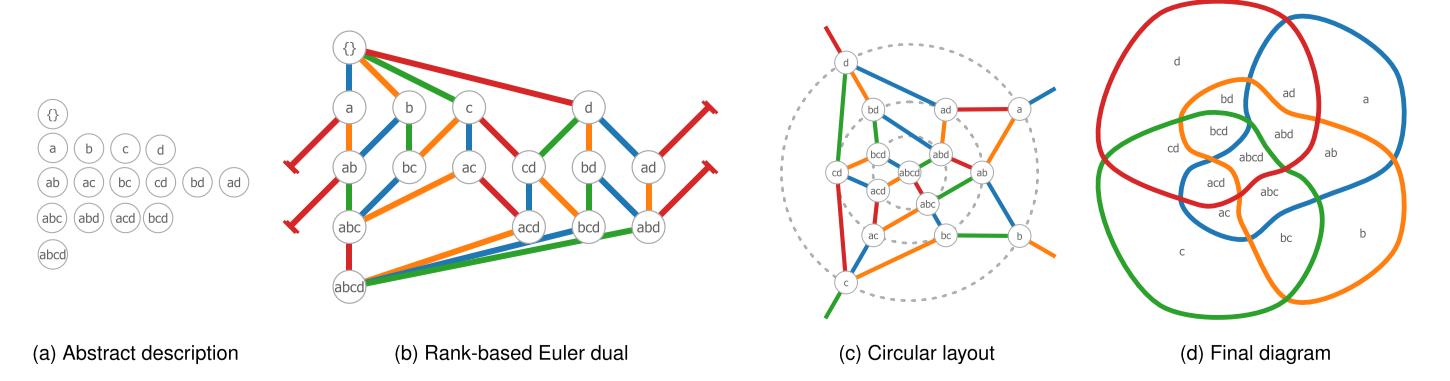
Figure 2: Overview of our method: After finding all set intersections that exist in the dataset (a), the rank-based Euler dual is created from the abstract description (b). The graph is then transformed to be circular, and nodes are arranged in a well-distributed manner across several rings (c). In (d) we create the final curve for each set using splines.
Results:
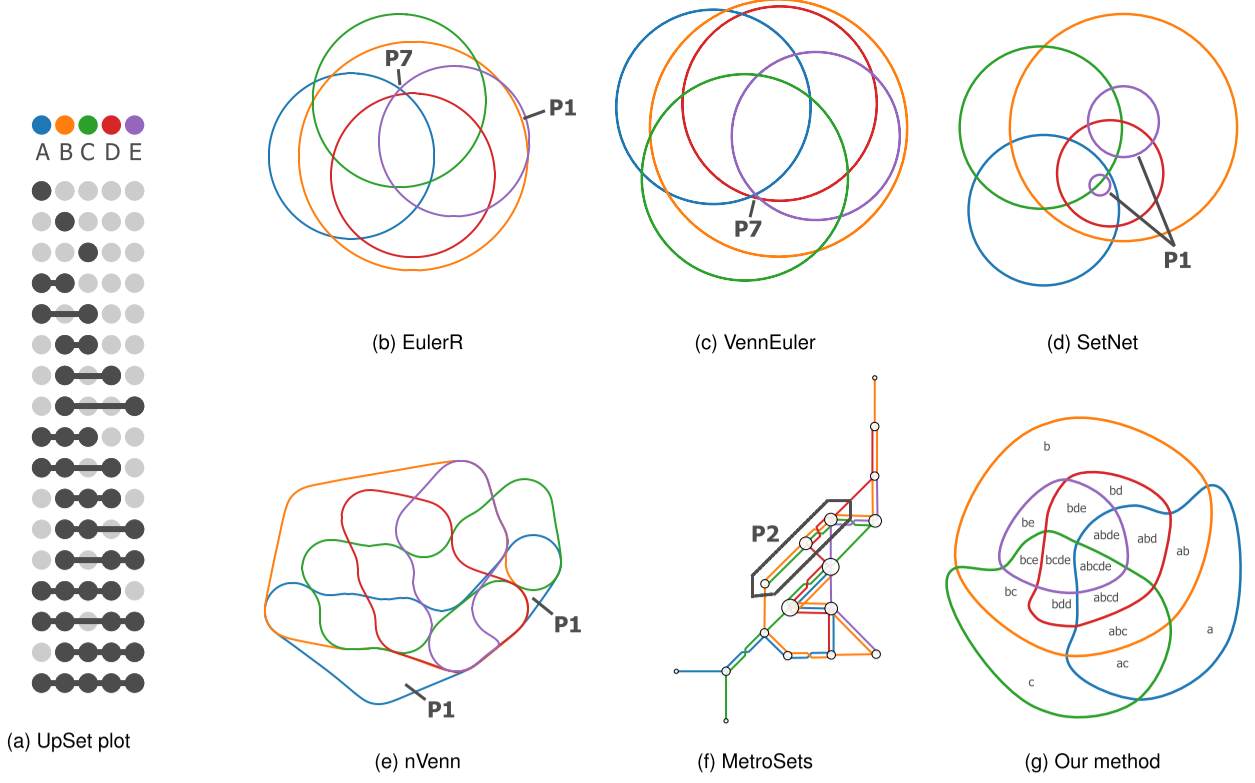
Figure 3: Comparing relevant previous works for Euler diagrams of a topic modeling dataset. Problems in the results are marked: these can either be not well-formed (P2), not well-matched (P1), or create zones that only have very little area (P7). Our method produces a result that does not destroy the well-formed and well-matched properties. The areas of the zones are distributed evenly and the shape is compact.
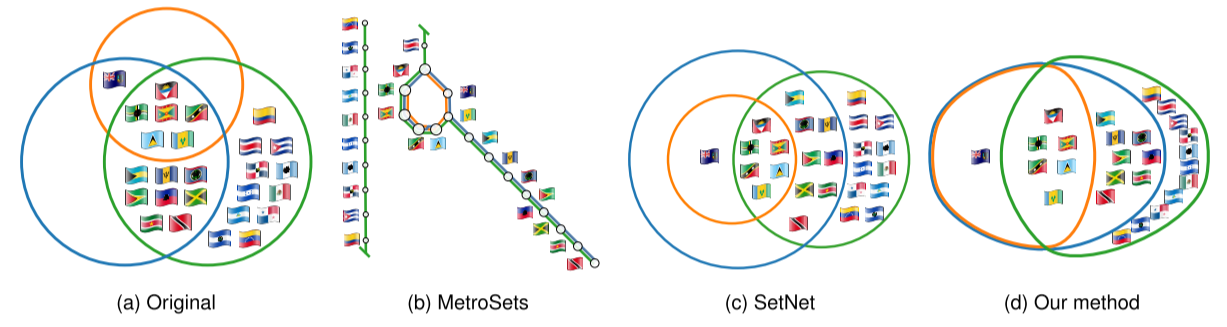
Figure 4: Here, we show a dataset of infographics concerning different supranational Caribbean bodies and their contained countries (a). While MetroSets is well-matched, the visualization requires a lot of space to show all the data points (b). Therefore, we introduced a discontinuity between
 Costa Rica and
  Colombia. SetNet introduces unwanted zones, as a does not contain any data points (c). Our diagram has only a
single concurrency and is well-matched (d).
Colombia. SetNet introduces unwanted zones, as a does not contain any data points (c). Our diagram has only a
single concurrency and is well-matched (d).