Improving the Robustness of Scagnostics
Accepted by IEEE InfoVis 2019
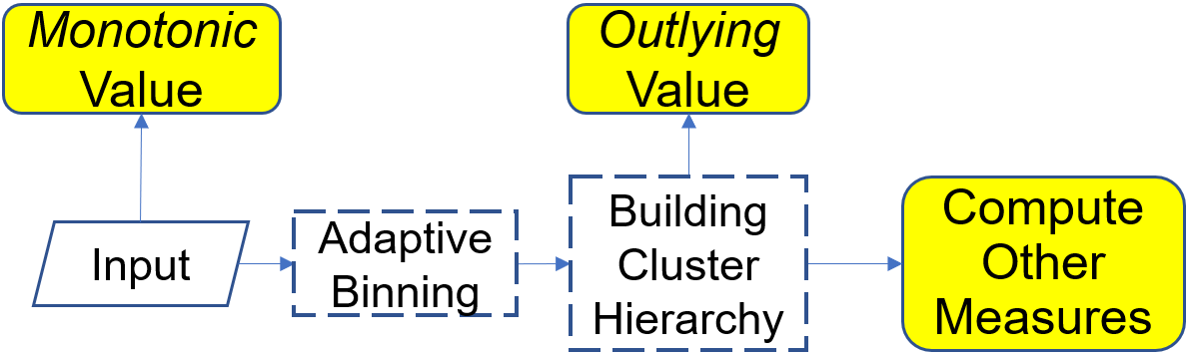
Figure 1: The pipeline for computing RScag. After adaptive binning and building the cluster hierachy, all measures are computed except the Monotonic measure.
Abstract:
In this paper, we examine the robustness of scagnostics through a series of theoretical and empirical studies. First, we investigate the sensitivity of scagnostics by employing perturbing operations on more than 60M synthetic and real-world scatterplots. We found that two scagnostic measures, Outlying and Clumpy, are overly sensitive to data binning. To understand how these measures align with human judgments of visual features, we conducted a study with 24 participants, which reveals that i) humans are not sensitive to small perturbations of the data that cause large changes in both measures, and ii) the perception of clumpiness heavily depends on per-cluster topologies and structures. Motivated by these results, we propose Robust Scagnostics (RScag) by combining adaptive binning with a hierarchy-based form of scagnostics. An analysis shows that RScag improves on the robustness of original scagnostics, aligns better with human judgments, and is equally fast as the traditional scagnostic measures.Materials:
Paper: [PDF].
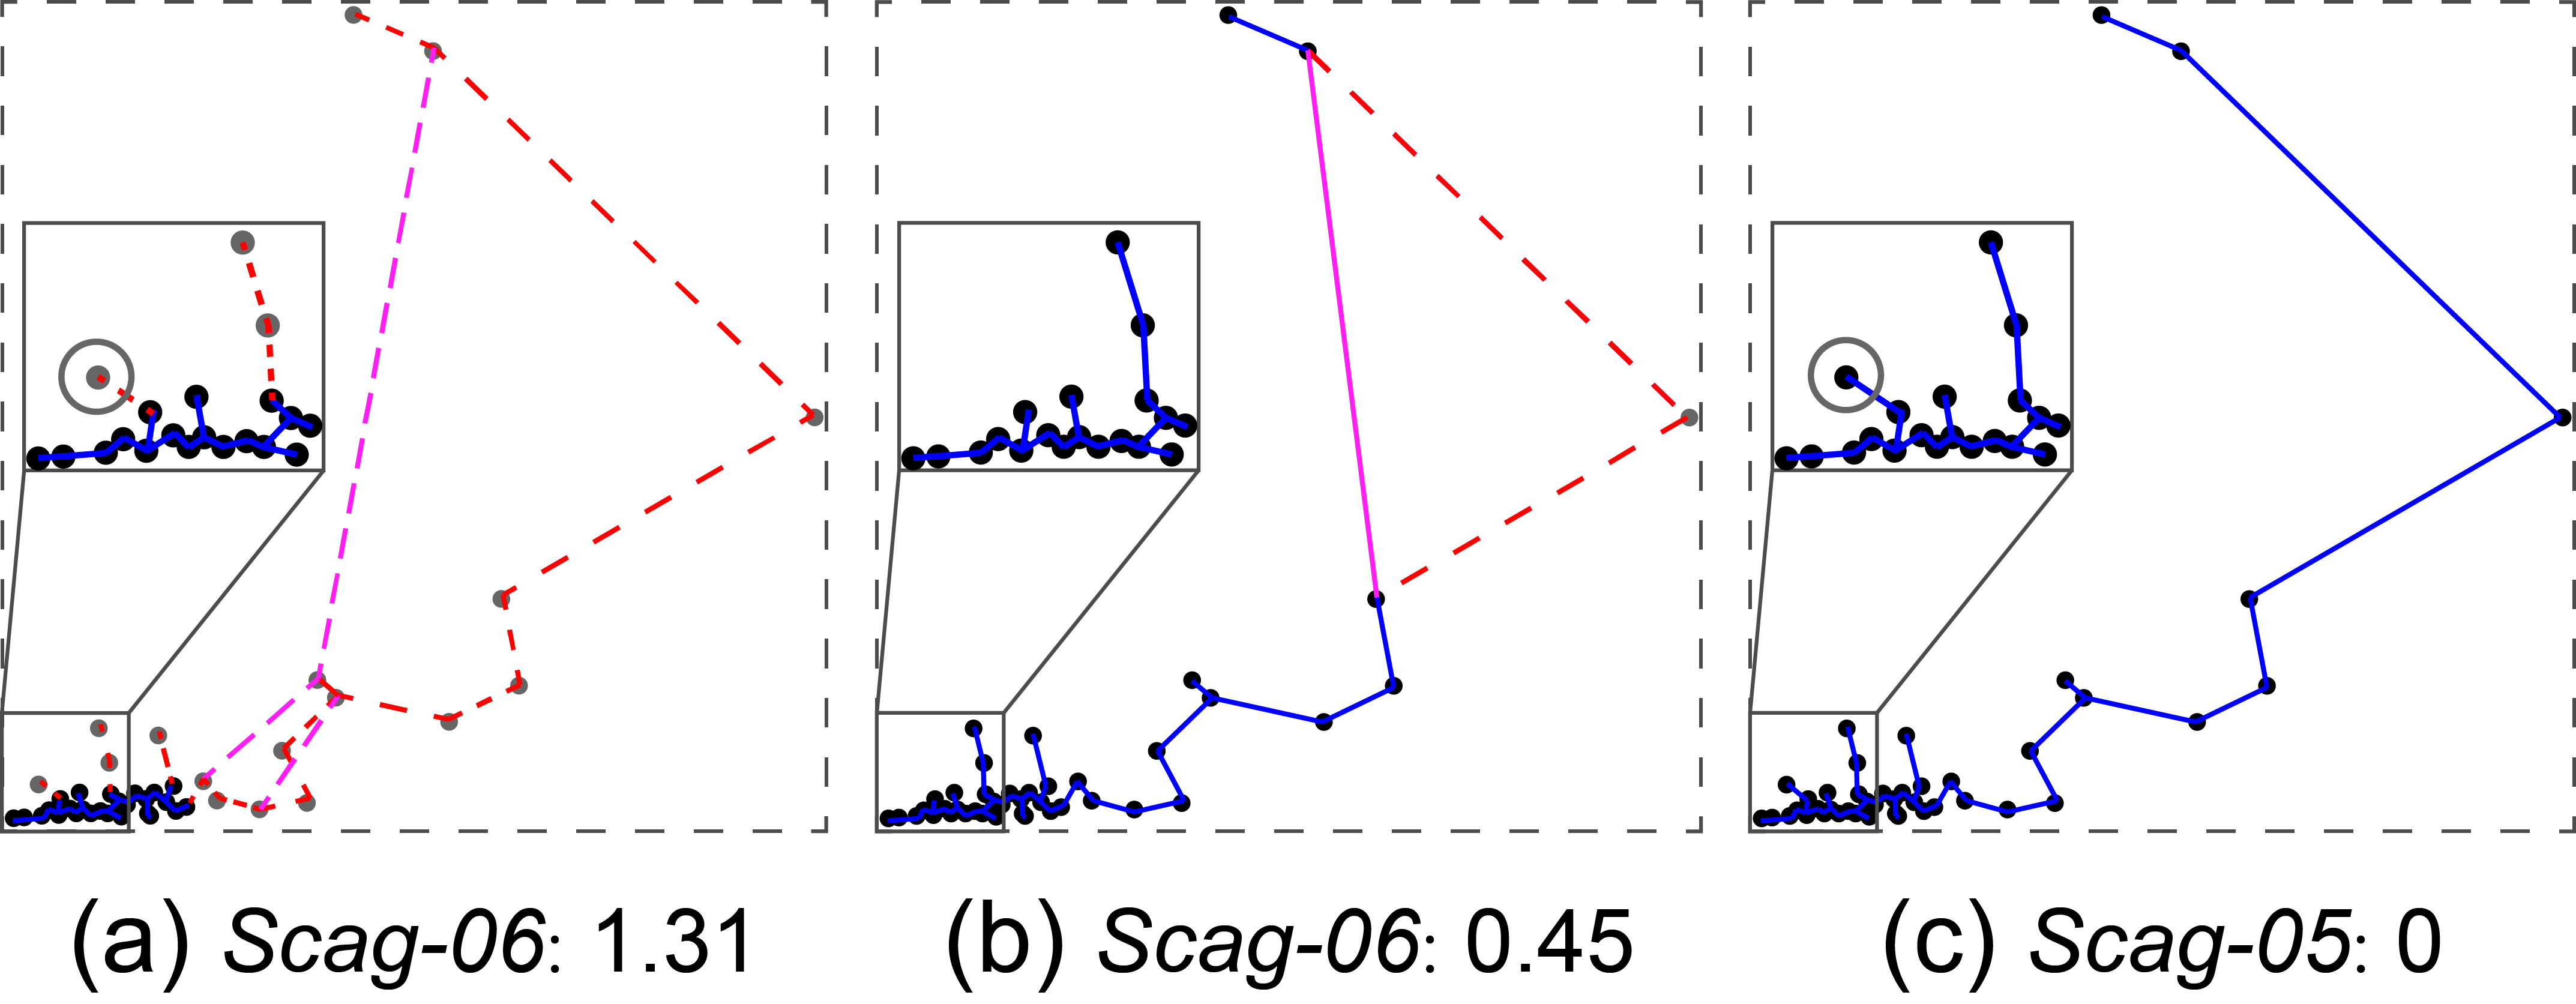
Figure 2: An example where the Outlying measure defined in Scag-06 is sensitive to perturbation, while the version in Scag-05 does not detect any outliers. The scatterplot and its final MST are defined by solid edges, while the dotted and pink lines depict deleted and the newly inserted edges during outlier deletion. (a,c) Original scatterplot and MST; (b) Scatterplot and MST generated by deleting the circled point in (a).
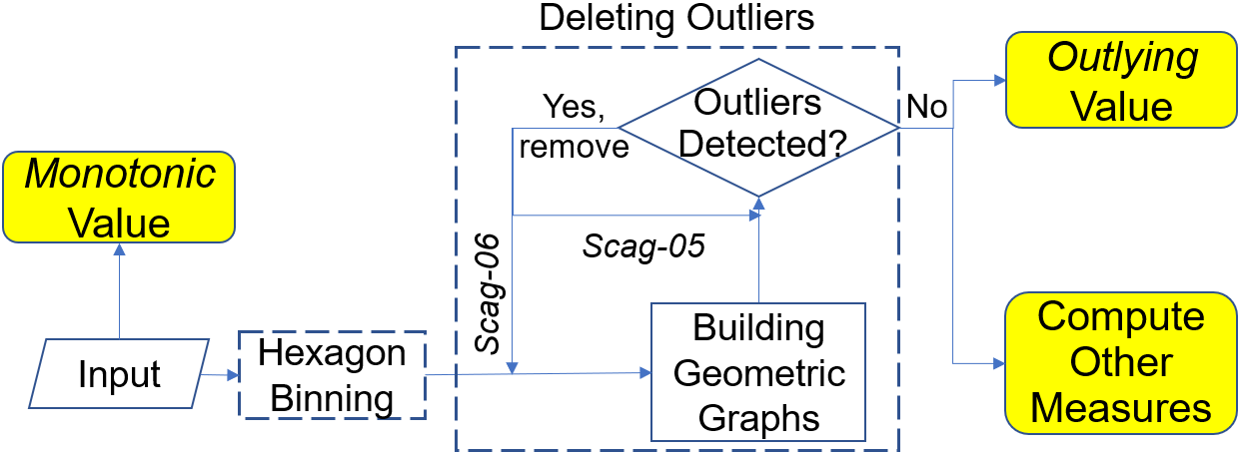
Figure 3: Pipeline for computing scagnostics, where the Outlying value is obtained after all outliers are removed, and then the other measures are computed.
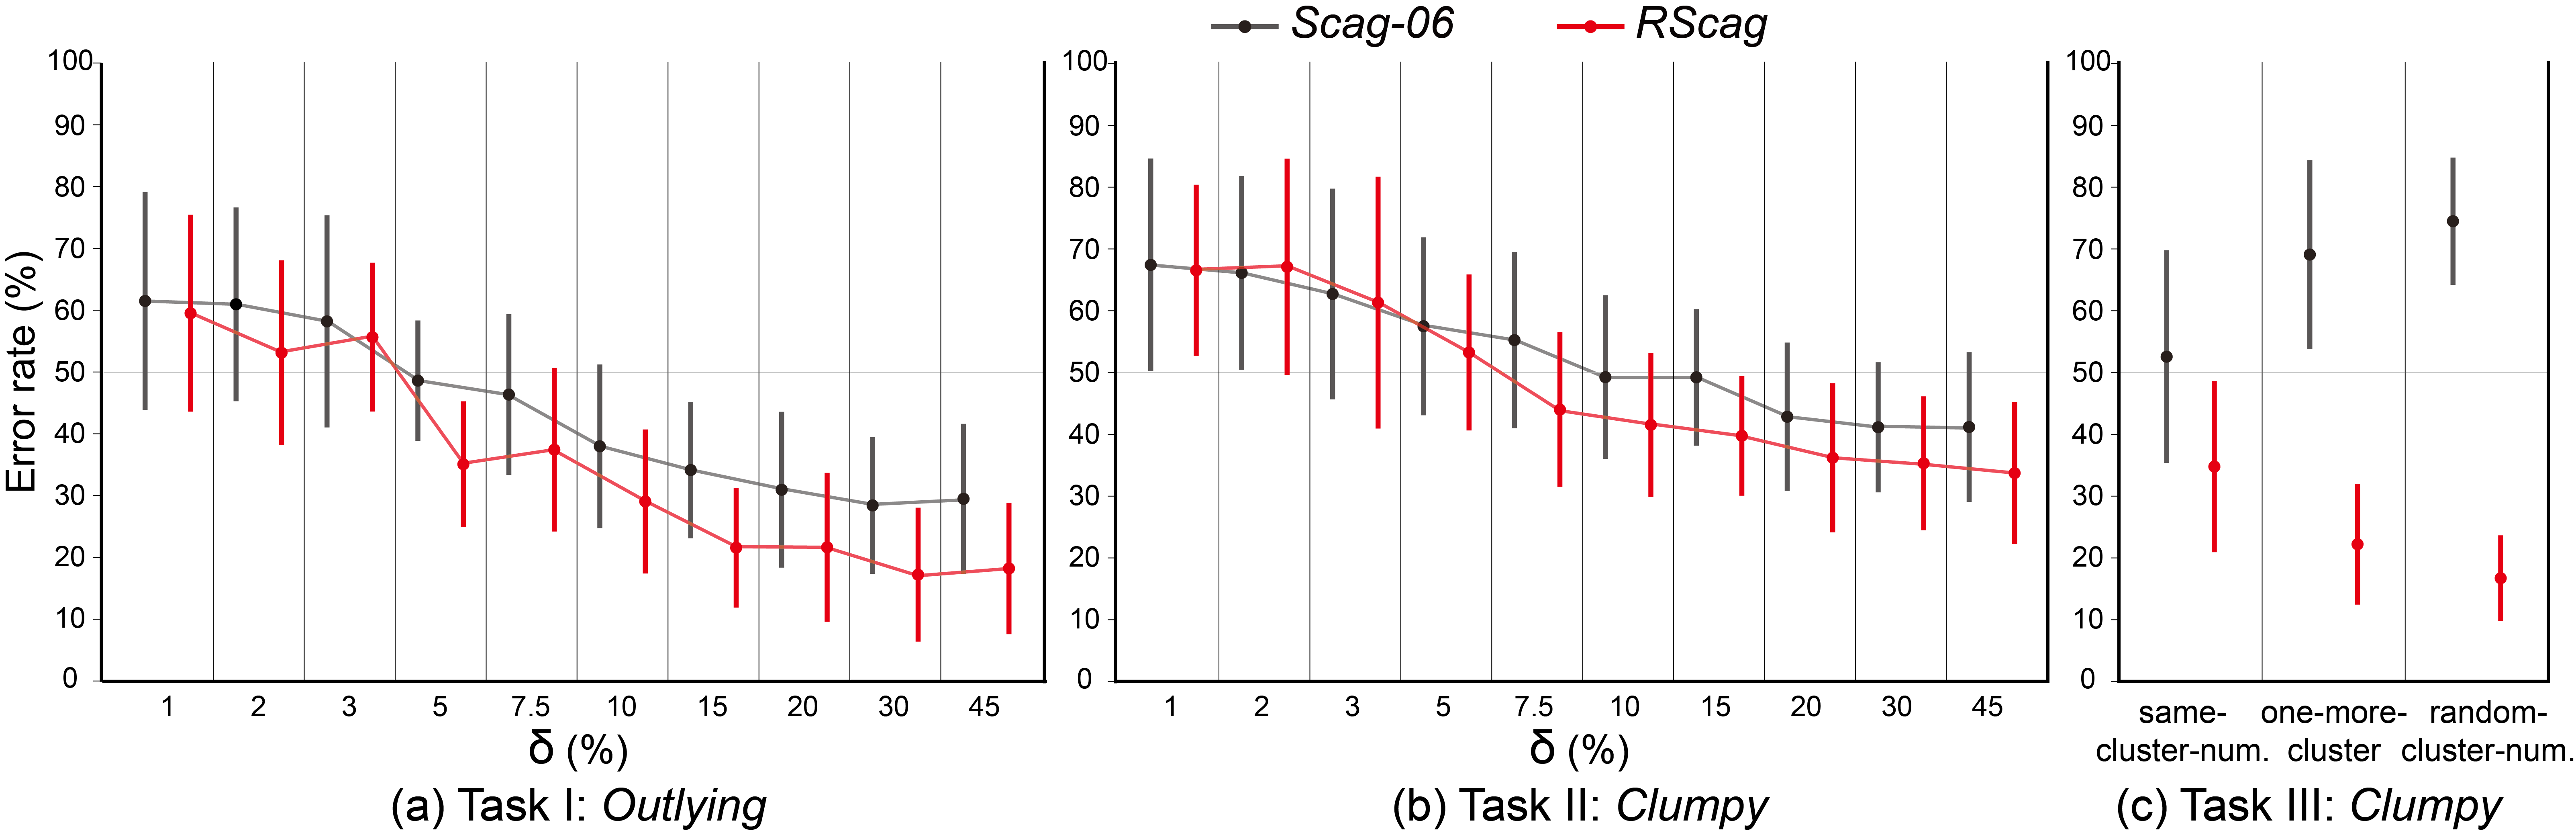
Figure 4: Results of the lab study: Mean values and deviation for 95% CIs of error rates in terms of Outlying (a) and Clumpy (b,c) measures, which are defined in Scag-06 are shown in black (see Section 5), while our proposed measures in red of each study (see Section 6).
Acknowledgment:
This work is supported by the grants of the National Key Research & Development Plan of China (2016YFB1001404), NSFC (61772315, 61861136012), the Leading Talents of Guangdong Program (00201509), the CAS grant (GJHZ1862), the Deutsche Forschungsgemeinschaft (DFG, German Research Foundation) � Projektnummer 251654672 � TRR 161, and the DFG Center of Excellence 2117 �Centre for the advanced Study of Collective Behaviour� (ID: 422037984).