A Recursive Subdivision Technique for Sampling Multi-class Scatterplots
IEEE Transactions on Visualization and Computer Graphics (Proc. InfoVis 2019), 2020
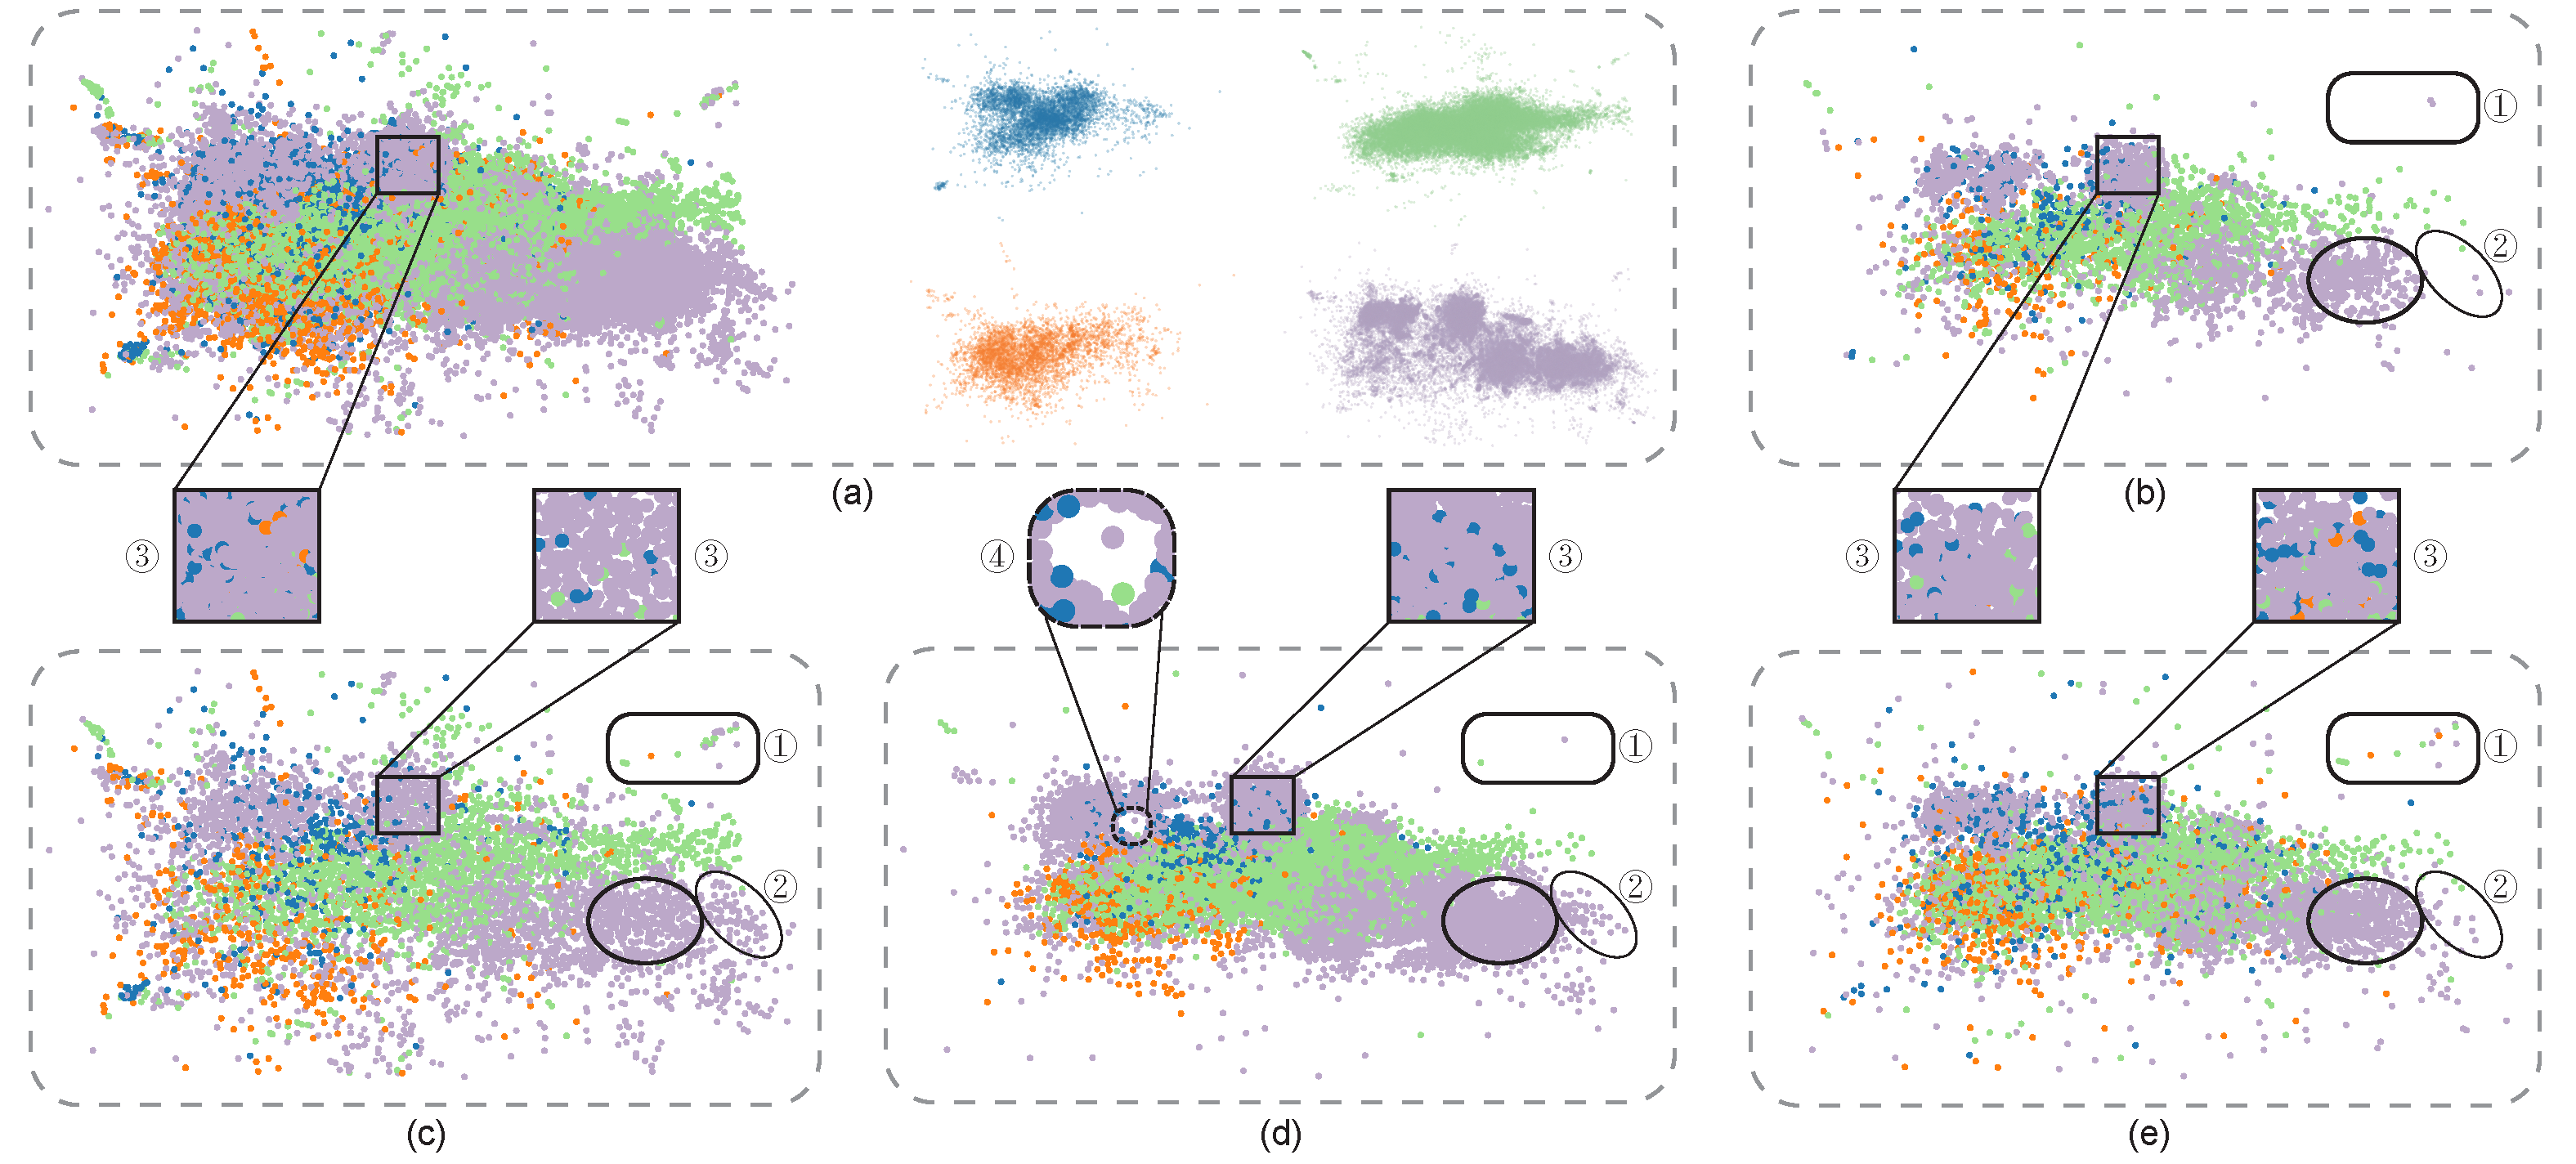
Figure 1: Different sampling methods for presenting the four-class Person Activity data [8]. (a) The left shows the input scatterplots with 100K points and the right shows the four classes separately, where the patterns of each class are obscured in the main plot, e.g., the three sub-clusters in the purple class, due to overdraw. We re-sample the data into ∼5000 points using (b) random sampling, (c) non-uniform sampling [4], (d) multi-class blue noise sampling [11], and (e) our method. The results show that our method better preserves major outliers (see the rounded boxes labeled with “1”), relative data densities (see the ellipse labeled with “2” to compare (c) with (d)), and the relative class densities (see the orange points shown in the squares labeled with “3” in (a)-(e)), without introducing obvious visual artifacts such as highlighted by the square in (d) labeled with “4”. Points for all results are rendered in random order.
Abstract:
We present a non-uniform recursive sampling technique for multi-class scatterplots, with the specific goal of faithfully presenting relative data and class densities, while preserving major outliers in the plots. Our technique is based on a customized binary kd-tree, in which leaf nodes are created by recursively subdividing the underlying multi-class density map. By backtracking, we merge leaf nodes until they encompass points of all classes for our subsequently applied outlier-aware multi-class sampling strategy. A quantitative evaluation shows that our approach can better preserve outliers and at the same time relative densities in multi-class scatterplots compared to the previous approaches, several case studies demonstrate the effectiveness of our approach in exploring complex and real world data.Materials:
Paper: [PDF 29.1M].
Supp: [PDF 12.2M].
Resource: [PDF 14.1M].
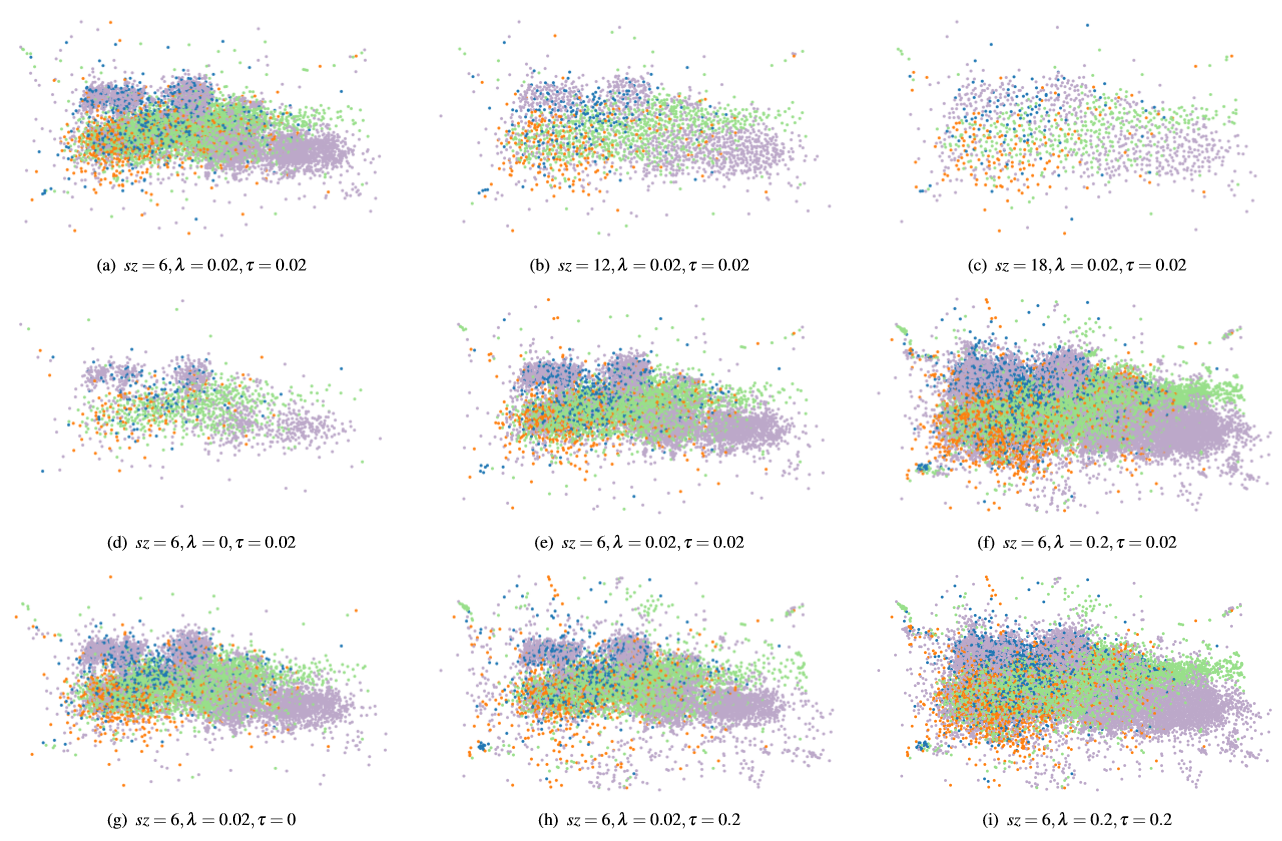
Figure 2: Parameter analysis for our method on the Person Activity data set. (a,b,c) Grid size influences the number of point samples. From left to right, the results have 5969, 2273, and 1217 points, respectively. (d,e,f) For a large λ, many outliers become visible, but overdraw happens in dense areas, while a small λ reduces overdraw but miss a few outliers. (g,e,h) A large τ shows too many outliers and regions of medium density are suppressed, while a small τ is more balanced but outliers are reduced. (i) When λ and τ both are large, the overdraw issue becomes severe while showing many outliers.
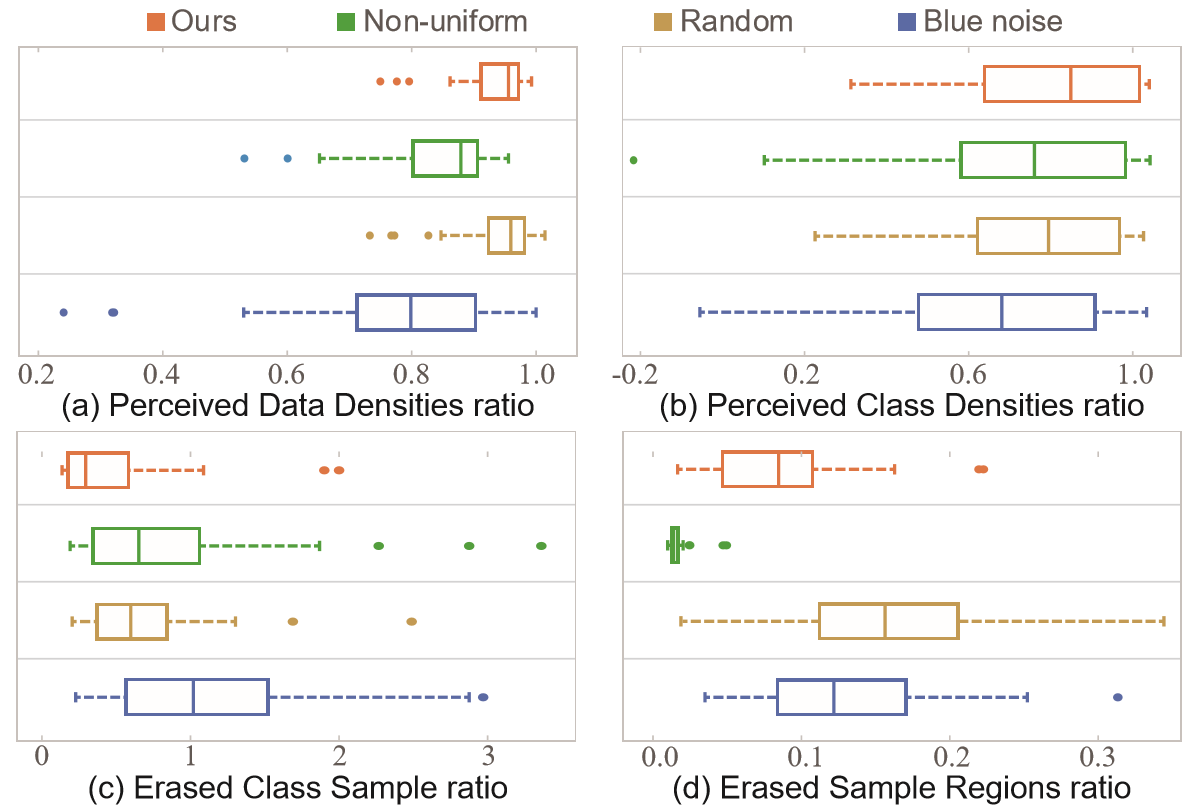
Figure 3: Boxplots summarizing the scores of four measures for four sampling methods over all tested datasets: (a) PDDr and (b) PCDr, where a higher score indicates better sampling for both measures; (c) ESRr and (d) ECSr, where a lower score indicates better sampling.
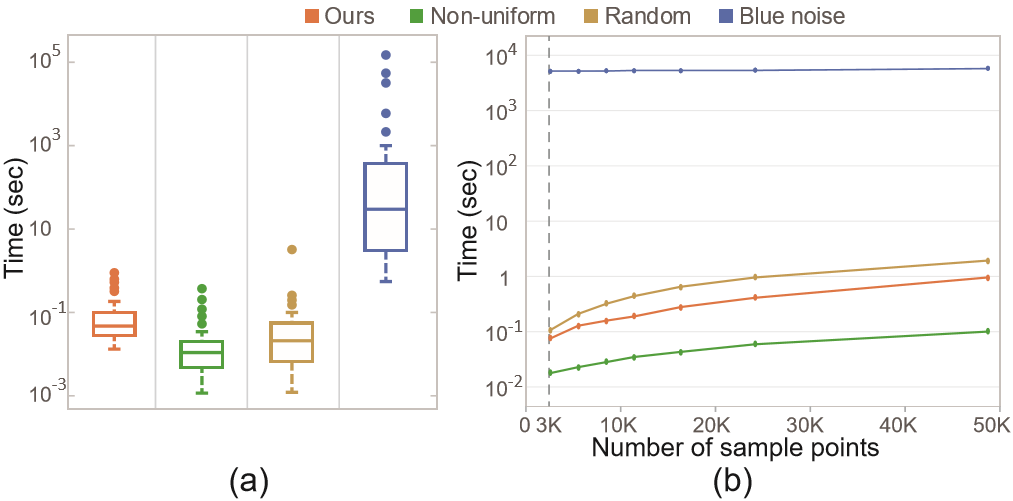
Figure 4: (a) Runtimes of the four sampling methods on all datasets; (b) relationship between runtime and sampled points on a synthesized dataset (250K points) (logarithmic scale).
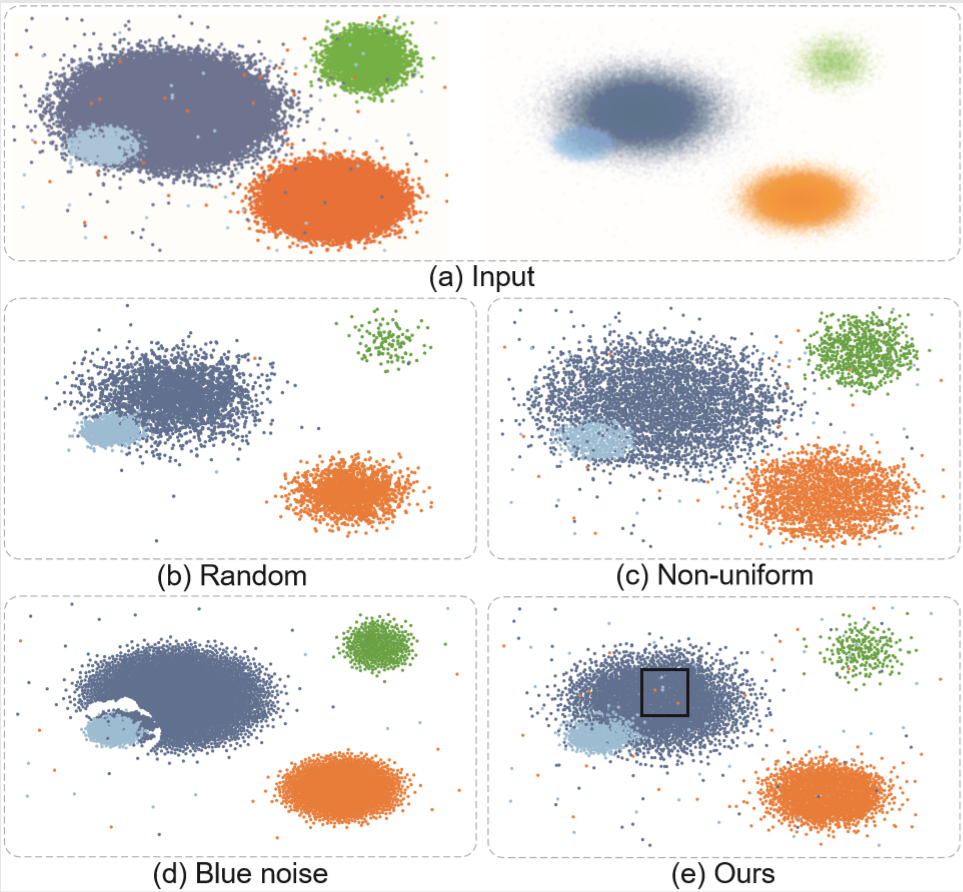
Figure 5: Sampled results of the synthetic dataset with 250K points. (a) original scatterplot (left) and four classes sampled individually (right), the transparency of each point is proportional to its density value; (b,c,d,e)results for 6K points generated by random sampling, non-uniform sampling, blue noise sampling, and our method.
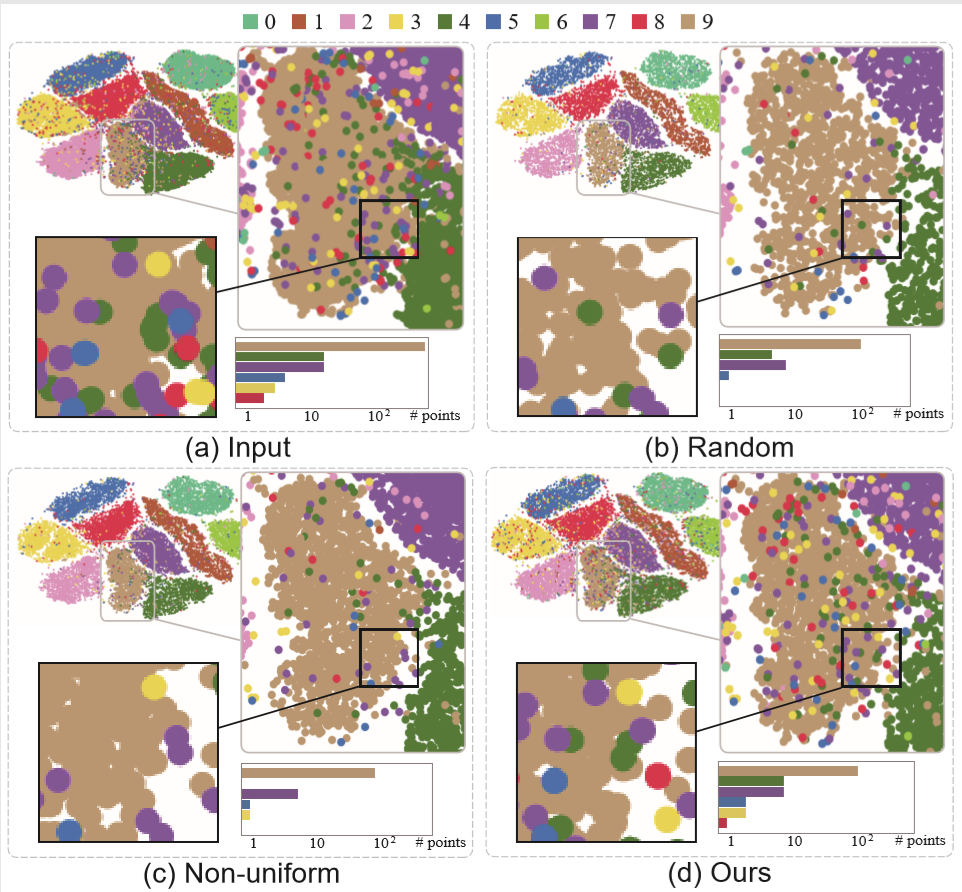
Figure 6: Sampled result of the MNIST dataset: (a)original scatterplot with 70K data points; (b,c,d) sampled results generated by random sampling, non-uniform sampling and our method.
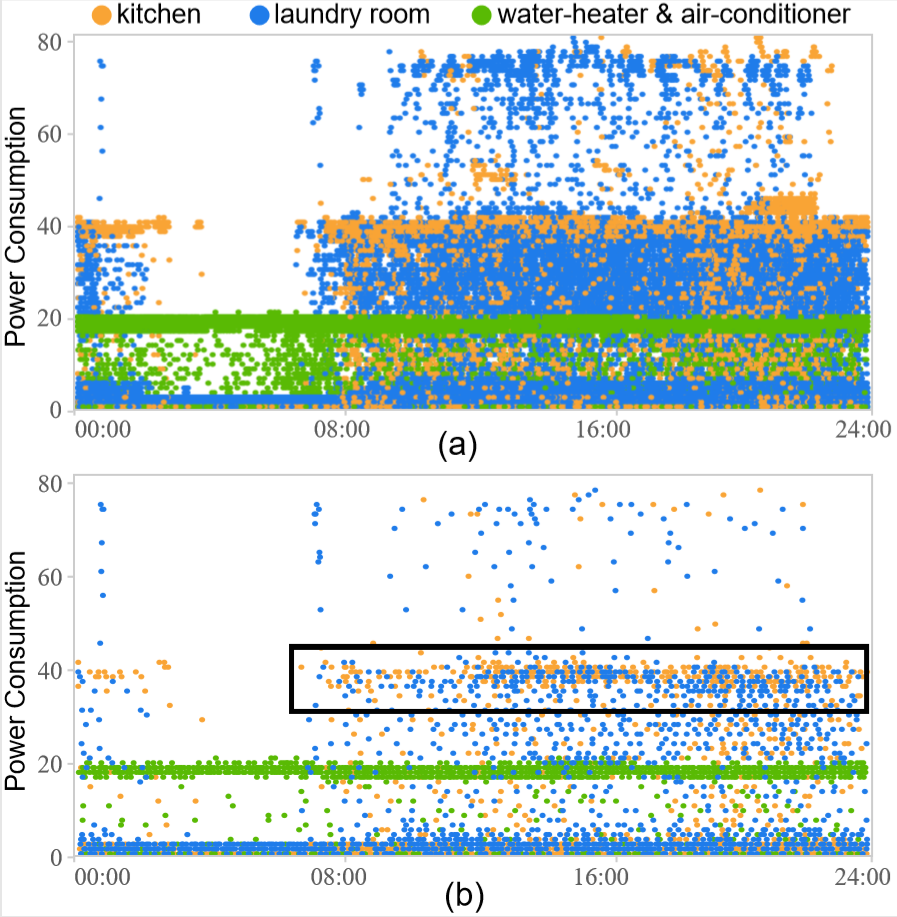
Figure 7: Exploration of the power consumption dataset with 1,570K data points: (a) the original scatterplot; (b) the sampled result generated by our method.
Acknowledgement:
This work is supported by the grants of the National Key Research & Development Plan of China (2016YFB1001404), NSFC (61772315, 61861136012), the Leading Talents of Guangdong Program (00201509), the DFG Center of Excellence 2117 “Centre for the advanced Study of Collective Behaviour” (ID: 422037984), the DFG Project 493/19 “Perception-based Information Visualization,” and Shenzhen Science and Technology Program (Project no. JCYJ20170413162617606).