SineStream: Improving the Readability of Streamgraphs by Minimizing Sine Illusion Effects
IEEE Transactions on Visualization and Computer Graphics (Proc. InfoVis 2020), 2021
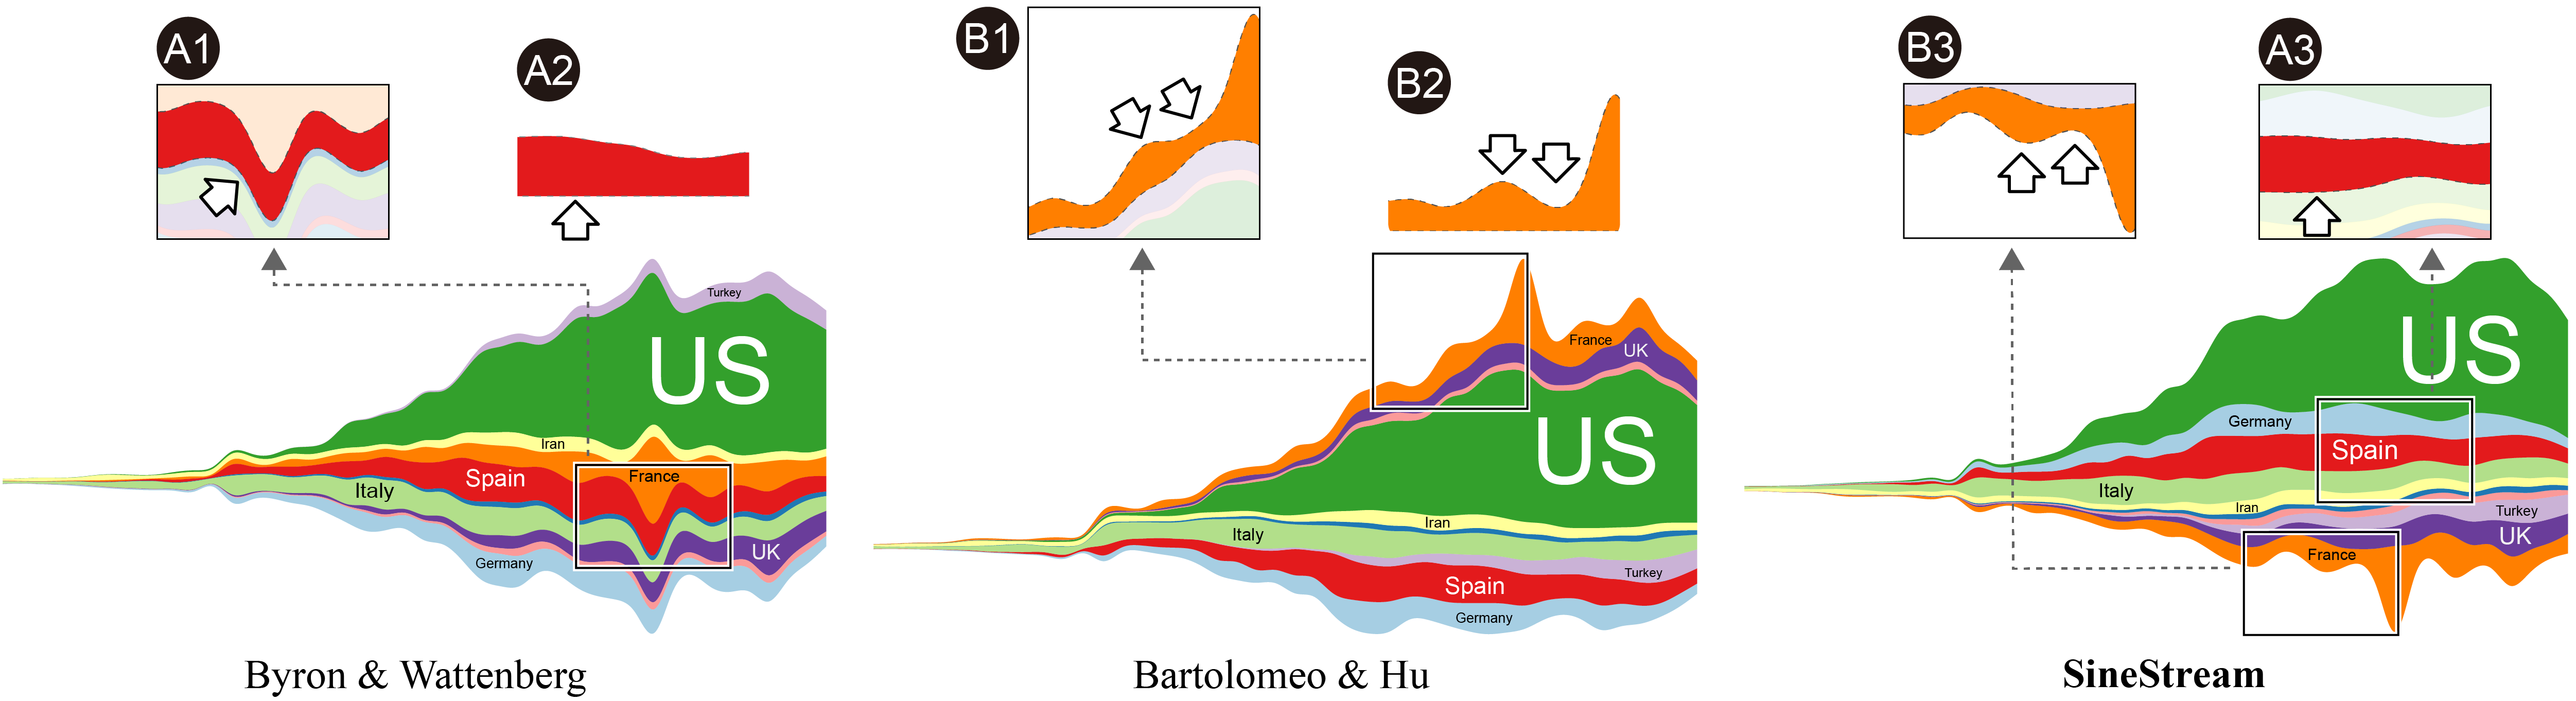
Figure 1: SineStream minimizes sine illusion effects stemming from strong slopes and improves the readability of streamgraphs by aligning the orthogonal and vertical orientations of each layer. We show the results on the COVID dataset [23] (top) and the Bank Interest dataset [30] (bottom). Sine illusions appear because the human eye is not able to accurately estimate the vertical distance between two curves with similar slopes. As indicated by the arrows on the top, our approach (A3, B3) better reflects the real thickness of layers (A2, B2) than previous works by Byron & Wattenberg [4] (A1) and Bartolomeo & Hu [10] (B1).
Abstract:
In this paper, we propose SineStream, a new variant of streamgraphs that improves their readability by minimizing sine illusion effects. Such effects reflect the tendency of humans to take the orthogonal rather than the vertical distance between two curves as their distance. In SineStream, we connect the readability of streamgraphs with minimizing sine illusions and by doing so provide a perceptual foundation for their design. As the geometry of a streamgraph is controlled by its baseline (the bottom-most curve) and the ordering of the layers, we re-interpret baseline computation and layer ordering algorithms in terms of reducing sine illusion effects. For baseline computation, we improve previous methods by introducing a Gaussian weight to penalize layers with large thickness changes. For layer ordering, three design requirements are proposed and implemented through a hierarchical clustering algorithm. Quantitative experiments and user studies demonstrate that SineStream improves the readability and aesthetics of streamgraphs compared to state-of-the-art methodsMaterials:
Paper: [PDF
4.5M].
Supp: [PDF 8.5M].
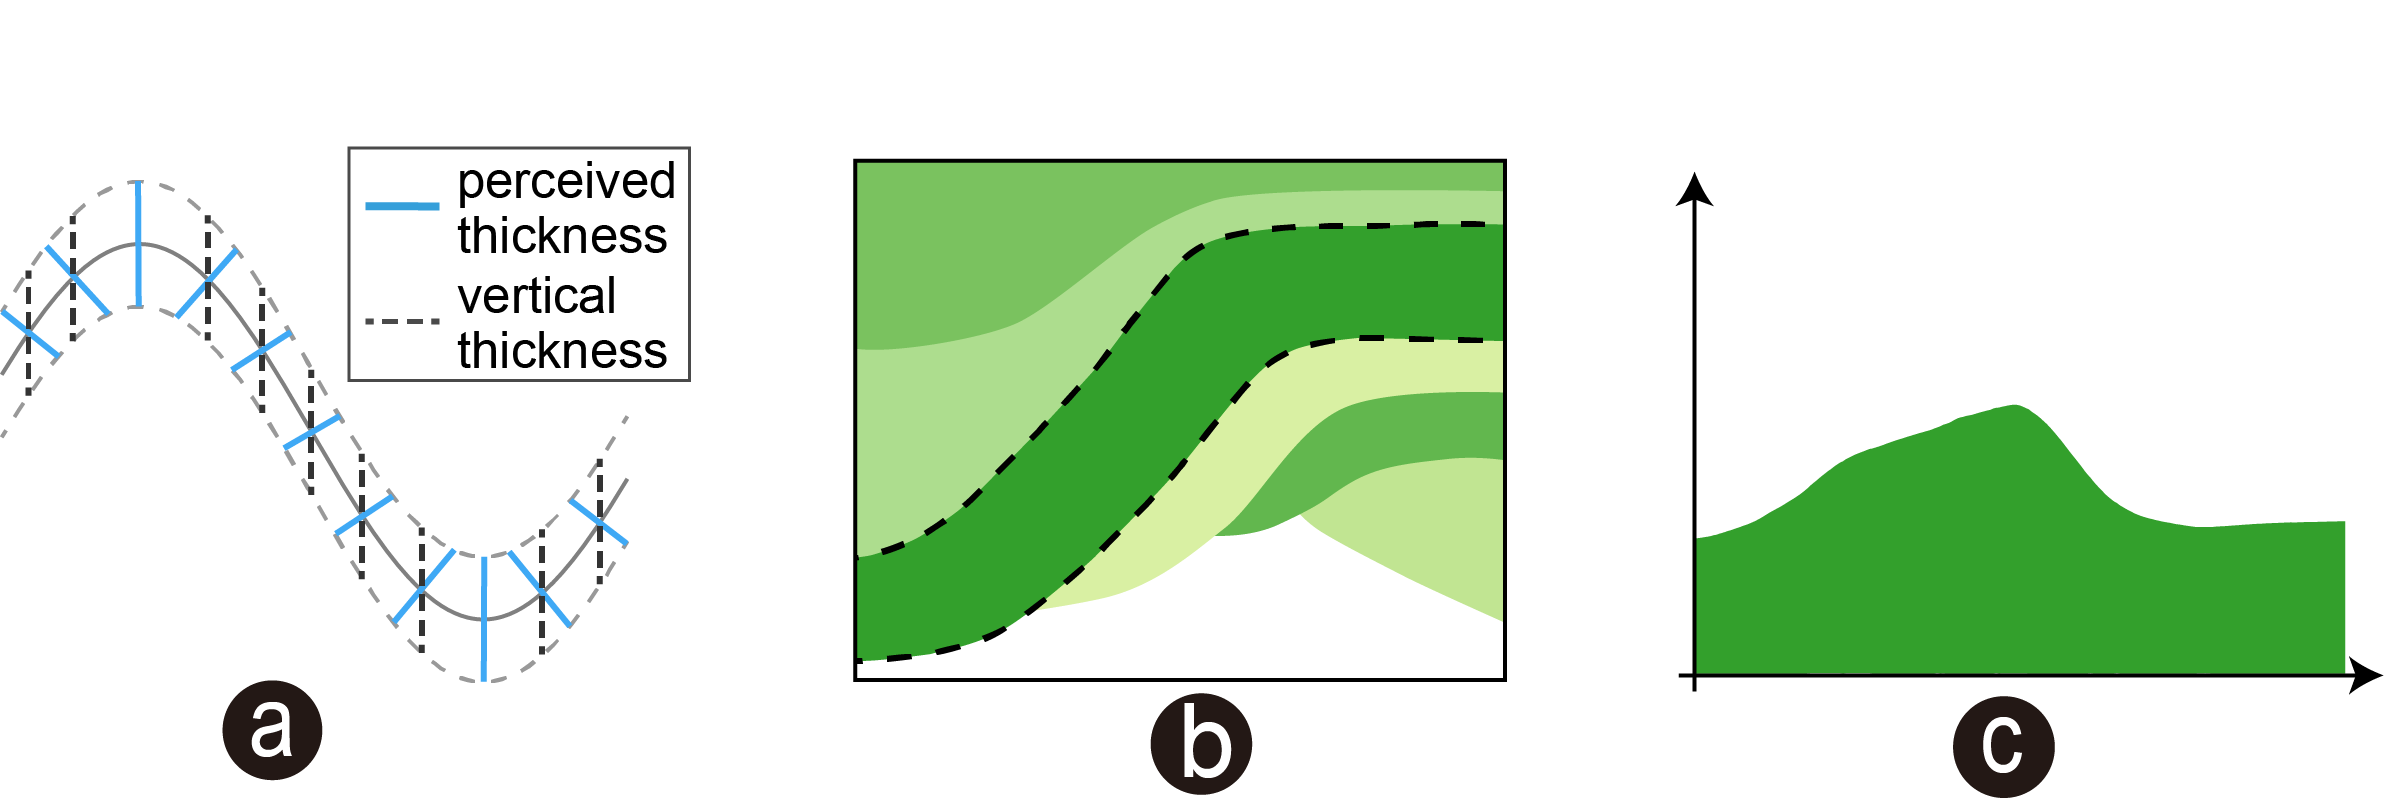
Figure 2: (a) A line with uniform thickness is drawn along a sinusoidal curve. Perception leads us to using the orthogonal distance rather than the vertical distance to determine its thickness. (b) The green layer with dotted border in the streamgraph seems to have a constant thickness. However, a peak occurs in its vertical thickness (c).
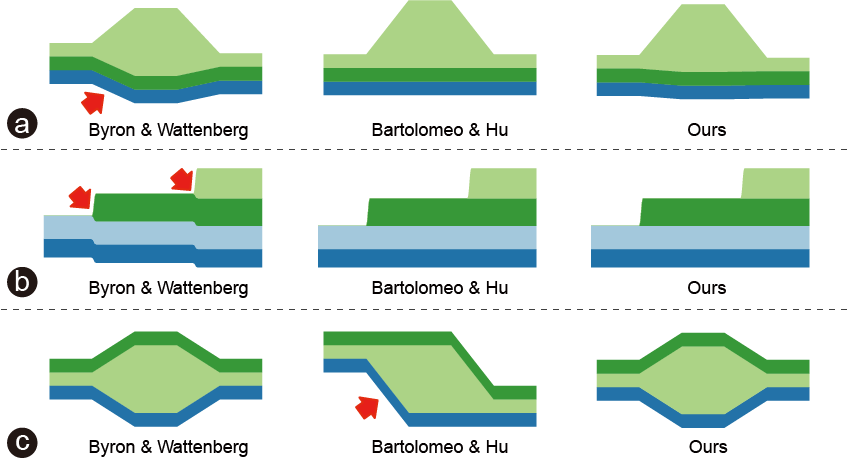
Figure 3: Each row represents streamgraphs with the same data and layer order, but different baseline computations. (a) Byron & Wattenberg [4] encourages [g'i ; g'i-1] to have equal absolute values and opposite signs, regardless of the increased sine illusion it causes to other layers. (b) This leads to unpleasant distortions when layers have sudden changes in thickness. (c) Bartolomeo & Hu [10] prefer a single distortion of a large layer rather than two smaller ones, which also leads to a larger illlusions.
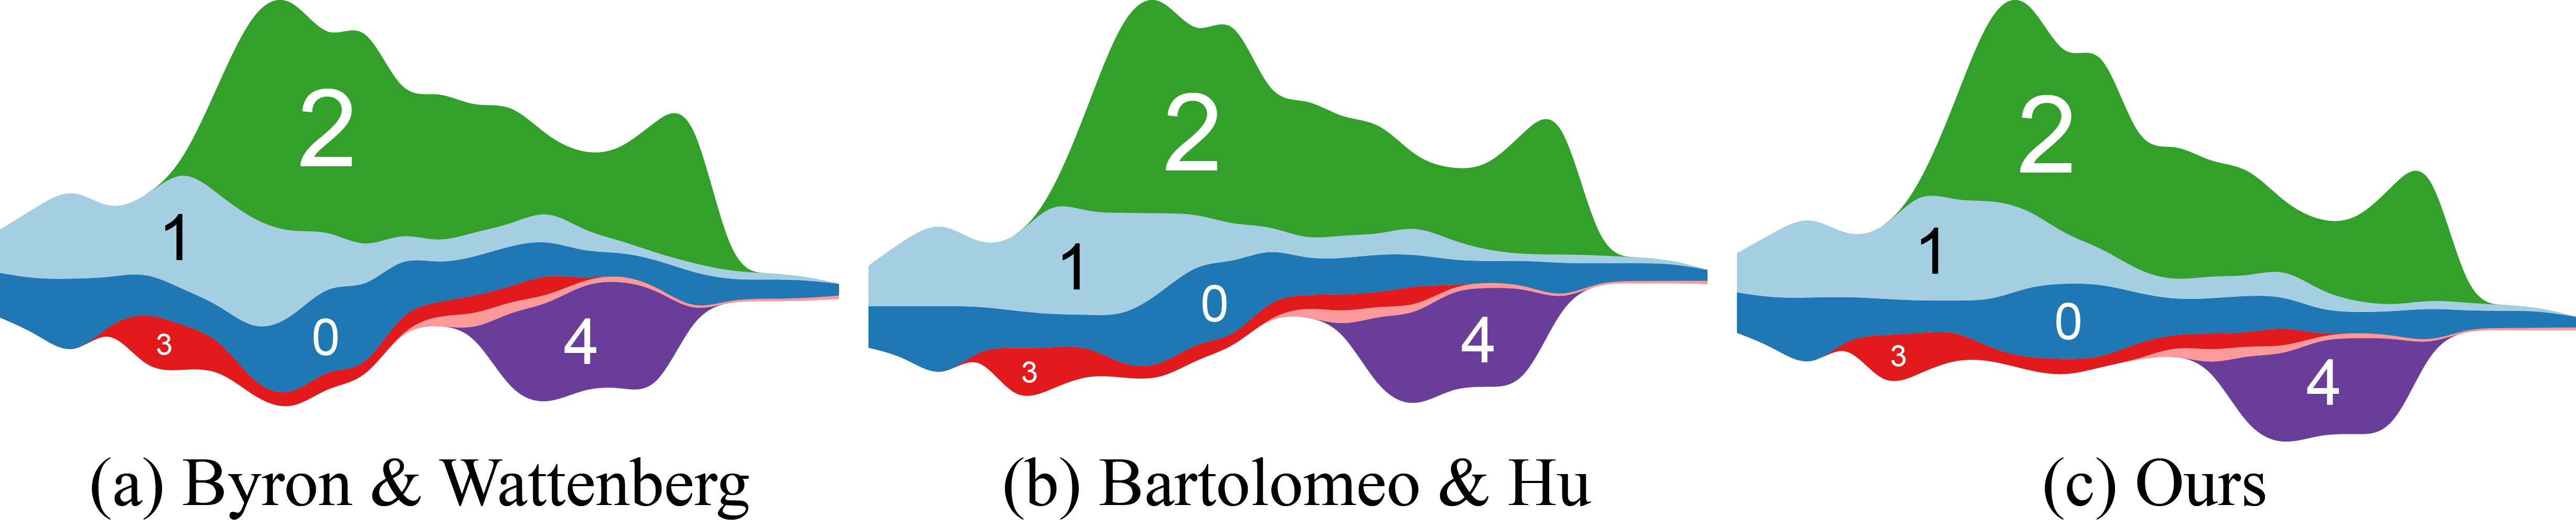
Figure 4: Three streamgraphs that use our ordering algorithm but different baseline optimizations: Wigglenorm2, Wigglenorm1, and sine illlusion.
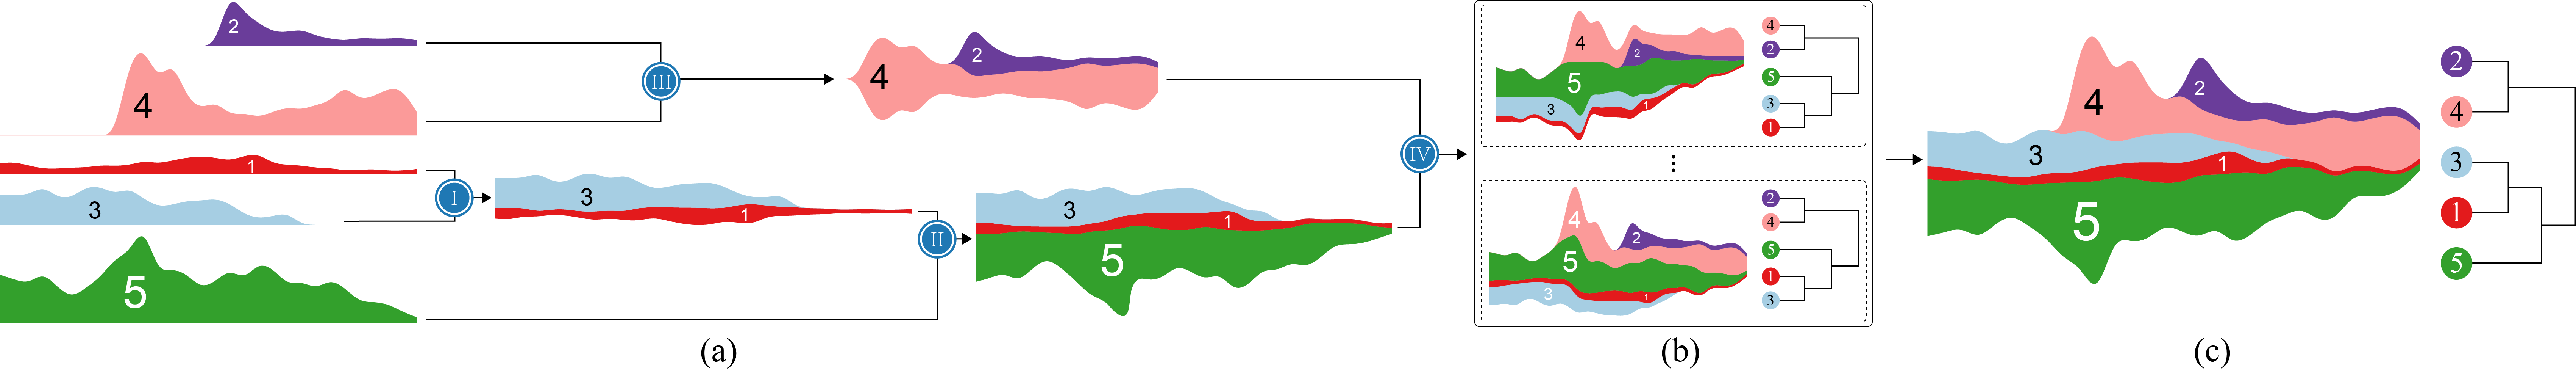
Figure 5: Layer ordering based on hierarchical clustering: (a) we hierarchically cluster layers with shortest distances and build a binary tree. Each node of the tree is a layer. The two children of an internal node are the two layers that are put together in the ordering. (b) Flipping internal nodes leads to different layer orderings, which incorporate different amounts of sine illusions. (c) We compute our ordering from the binary tree by minimizing the sum of distances between adjacent layers.
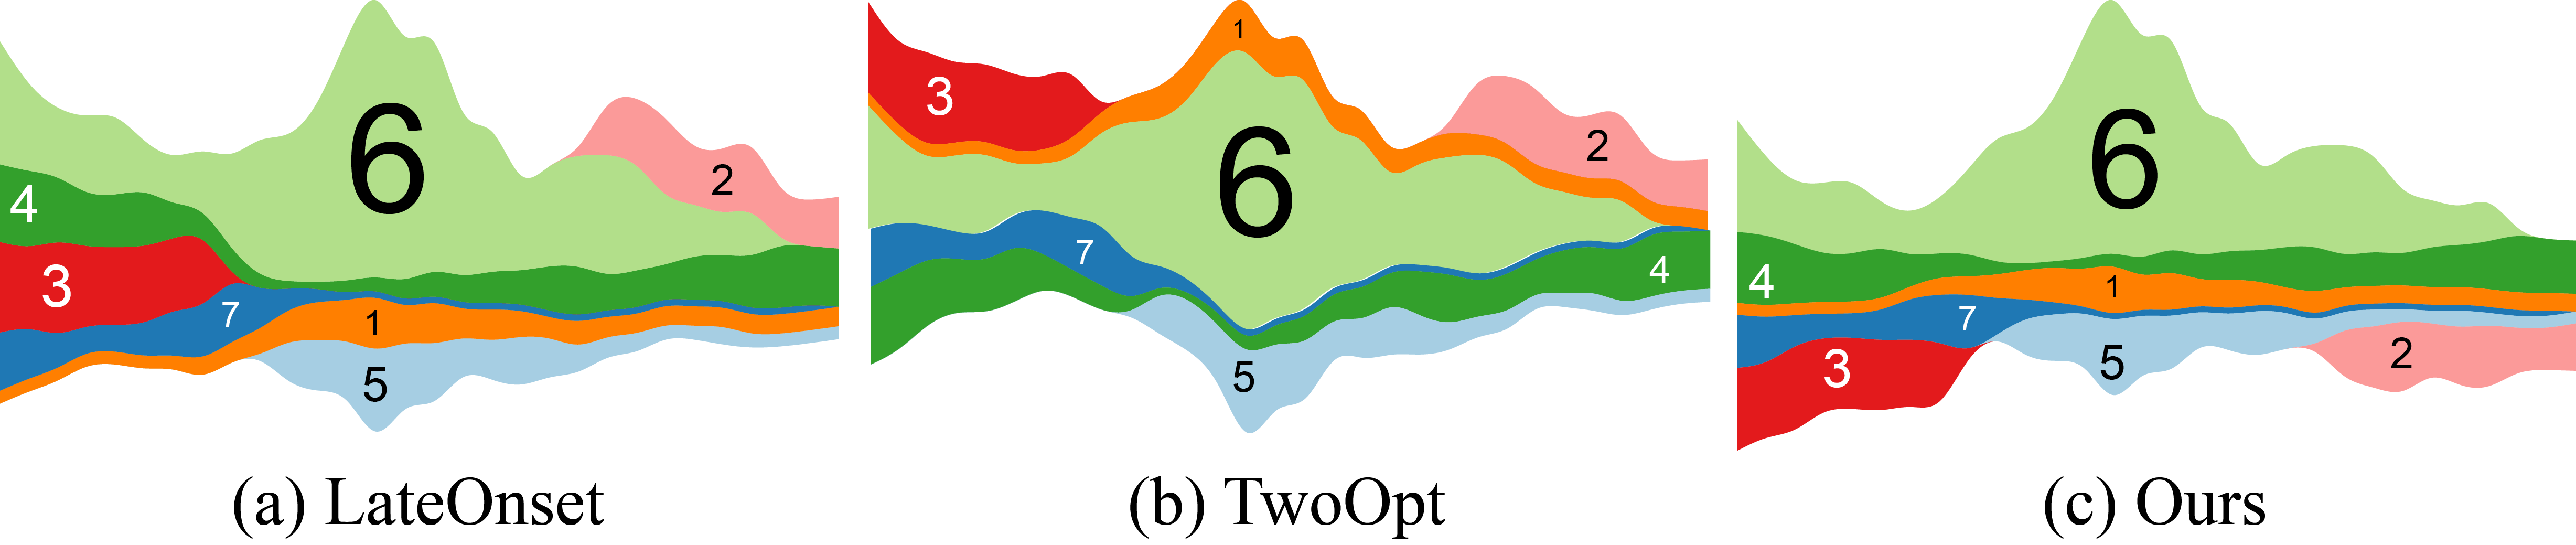
Figure 6: Three streamgraphs using the same baseline optimization but different ordering algorithms: LateOnset, TwoOpt, and our algorithm.
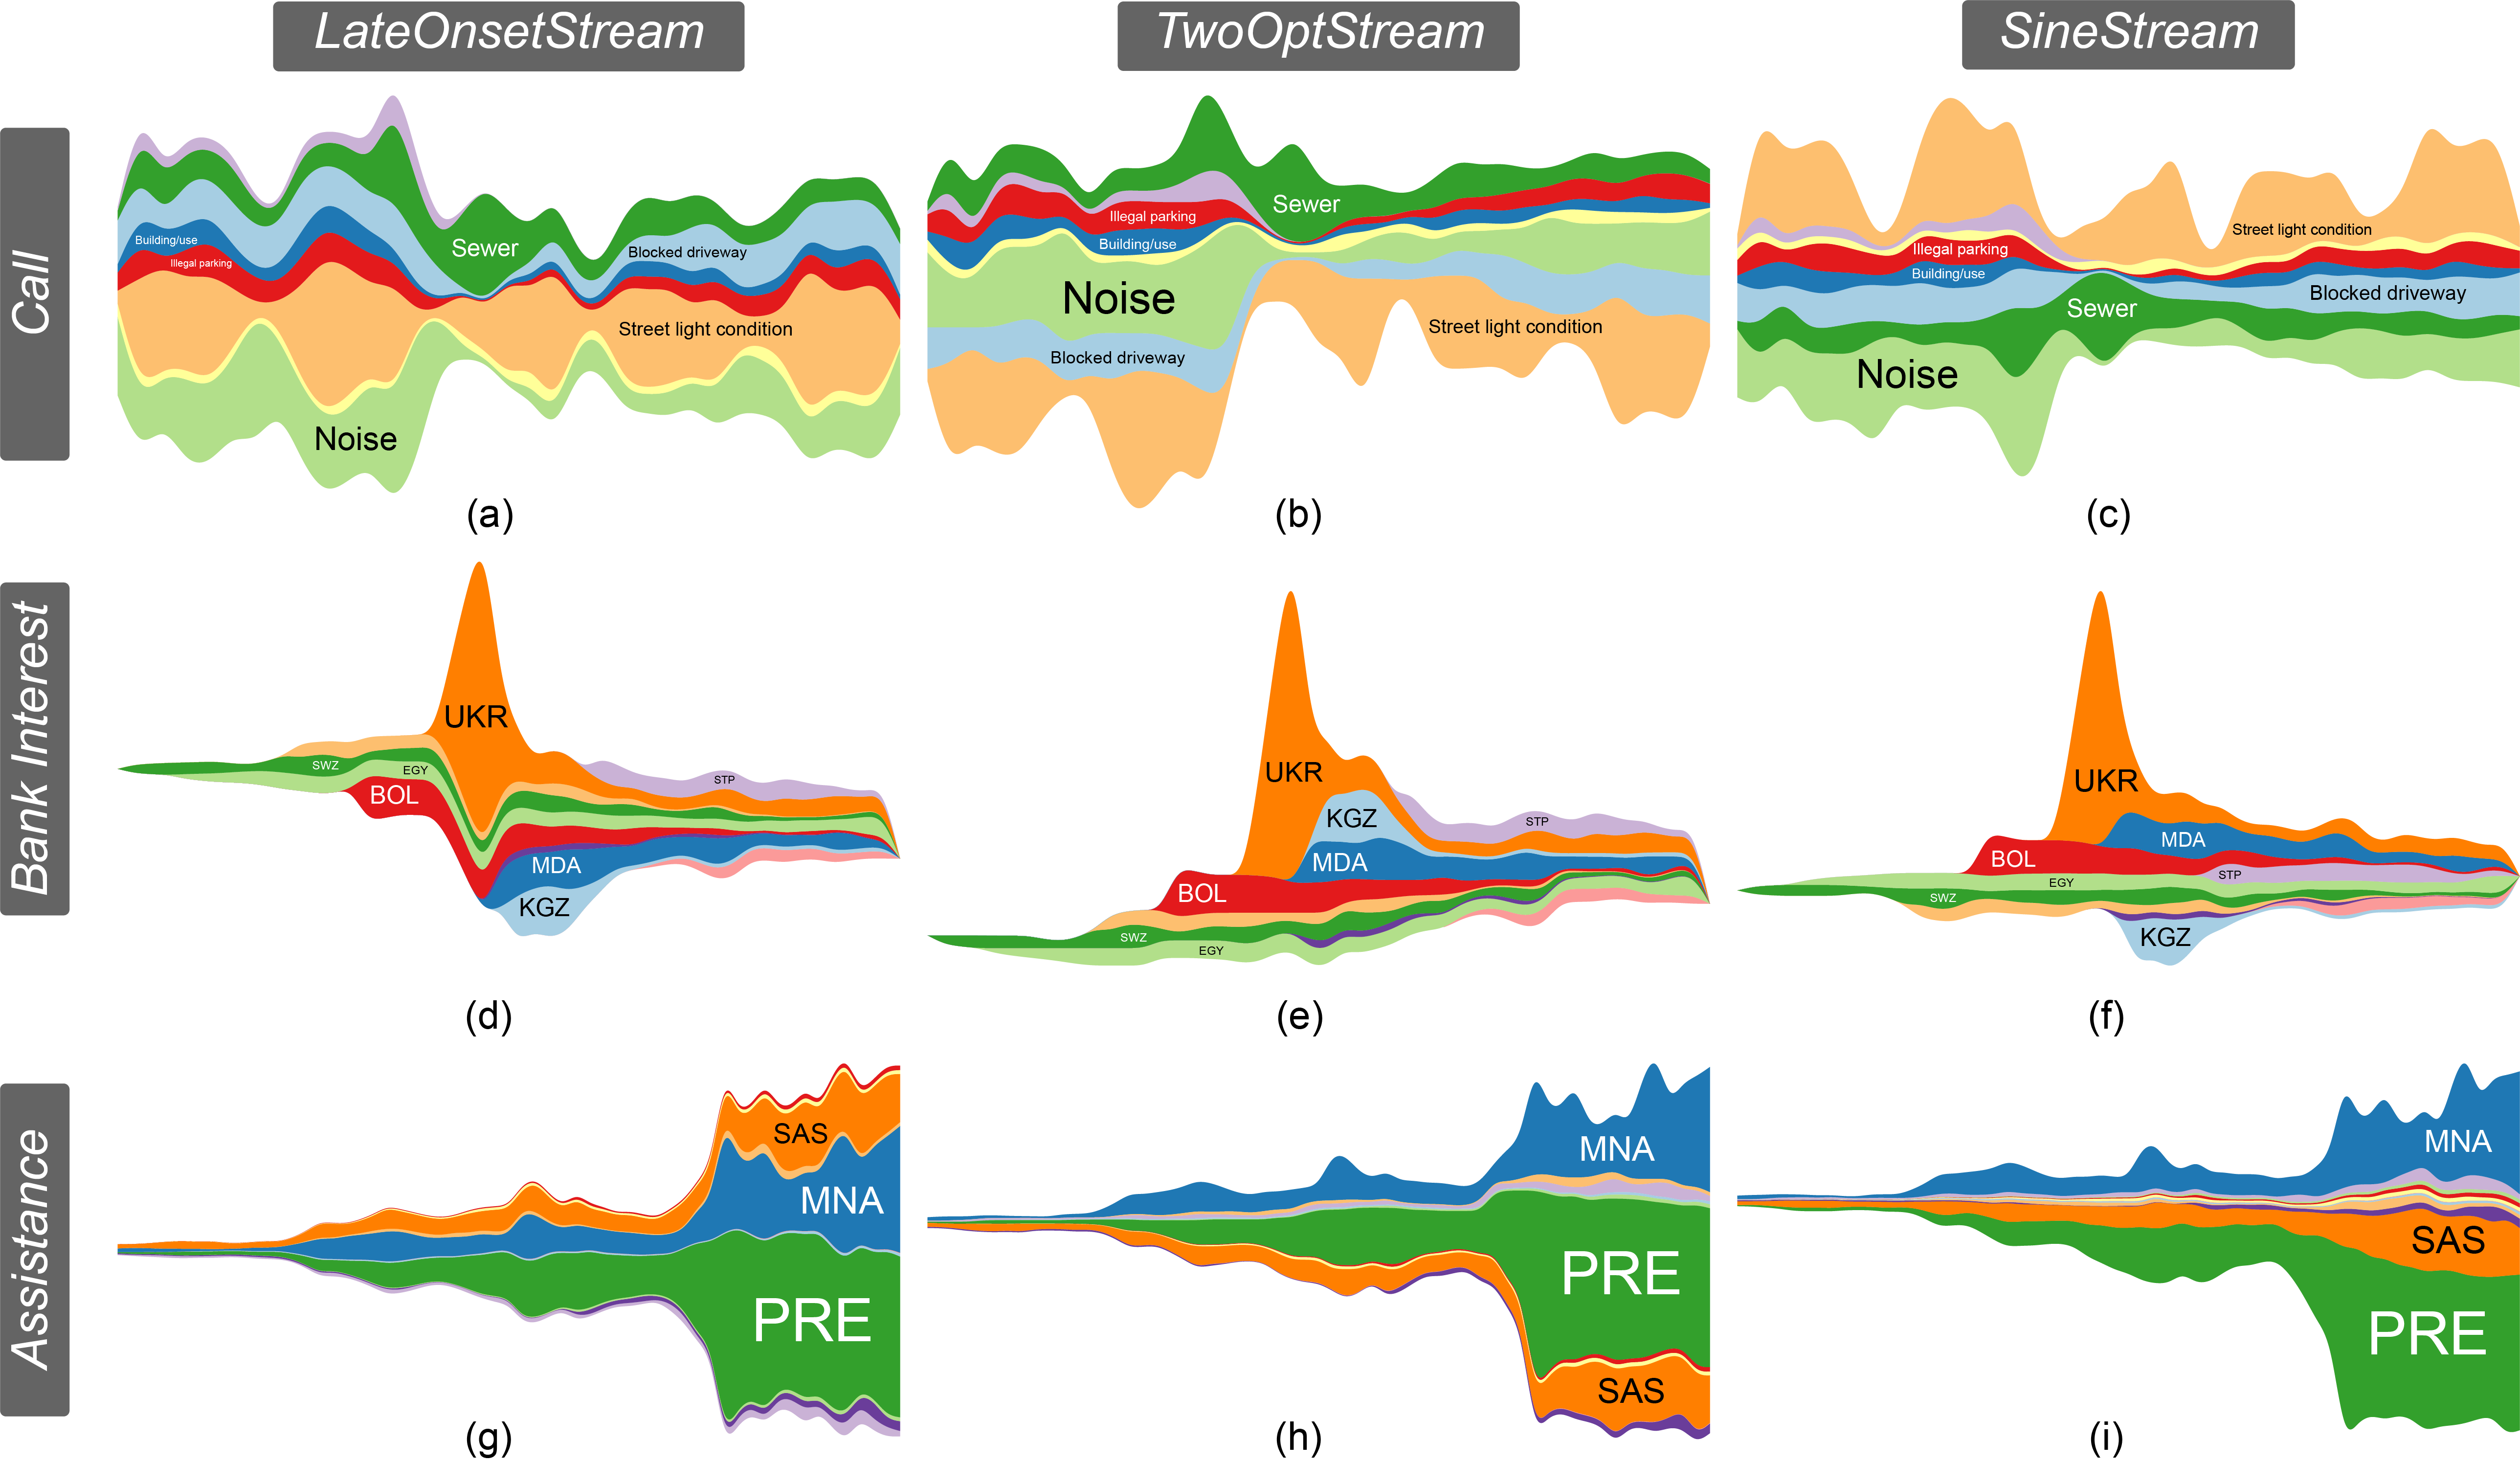
Figure 7: Comparing LateOnsetStream [4], TwoOptStream [10], and SineStream for the Call dataset [29] (top), the Bank Interest dataset [30] (middle) and the Assistance dataset [30] (bottom). The streamgraphs are drawn using different baselines and layer orderings.
Acknowledgement:
This work is supported by the grants of the NSFC (61772315, 61861136012) and Deutsche Forschungsgemeinschaft (DFG) ProjectIDs DE 620/26-1, as well as 251654672 (TRR 161 Quantitative methods for visual computing).