Flint: A Semantic-driven Data Visualization Intermediate Language
Yunhai Wang1
Kecheng Lu1
Junhao Chen1
Alper Sarikaya2
Chenglong Wang2
1Renmin University of China
2Microsoft, Redmond,
Washington, United States
Accepted by IEEE VIS 2026
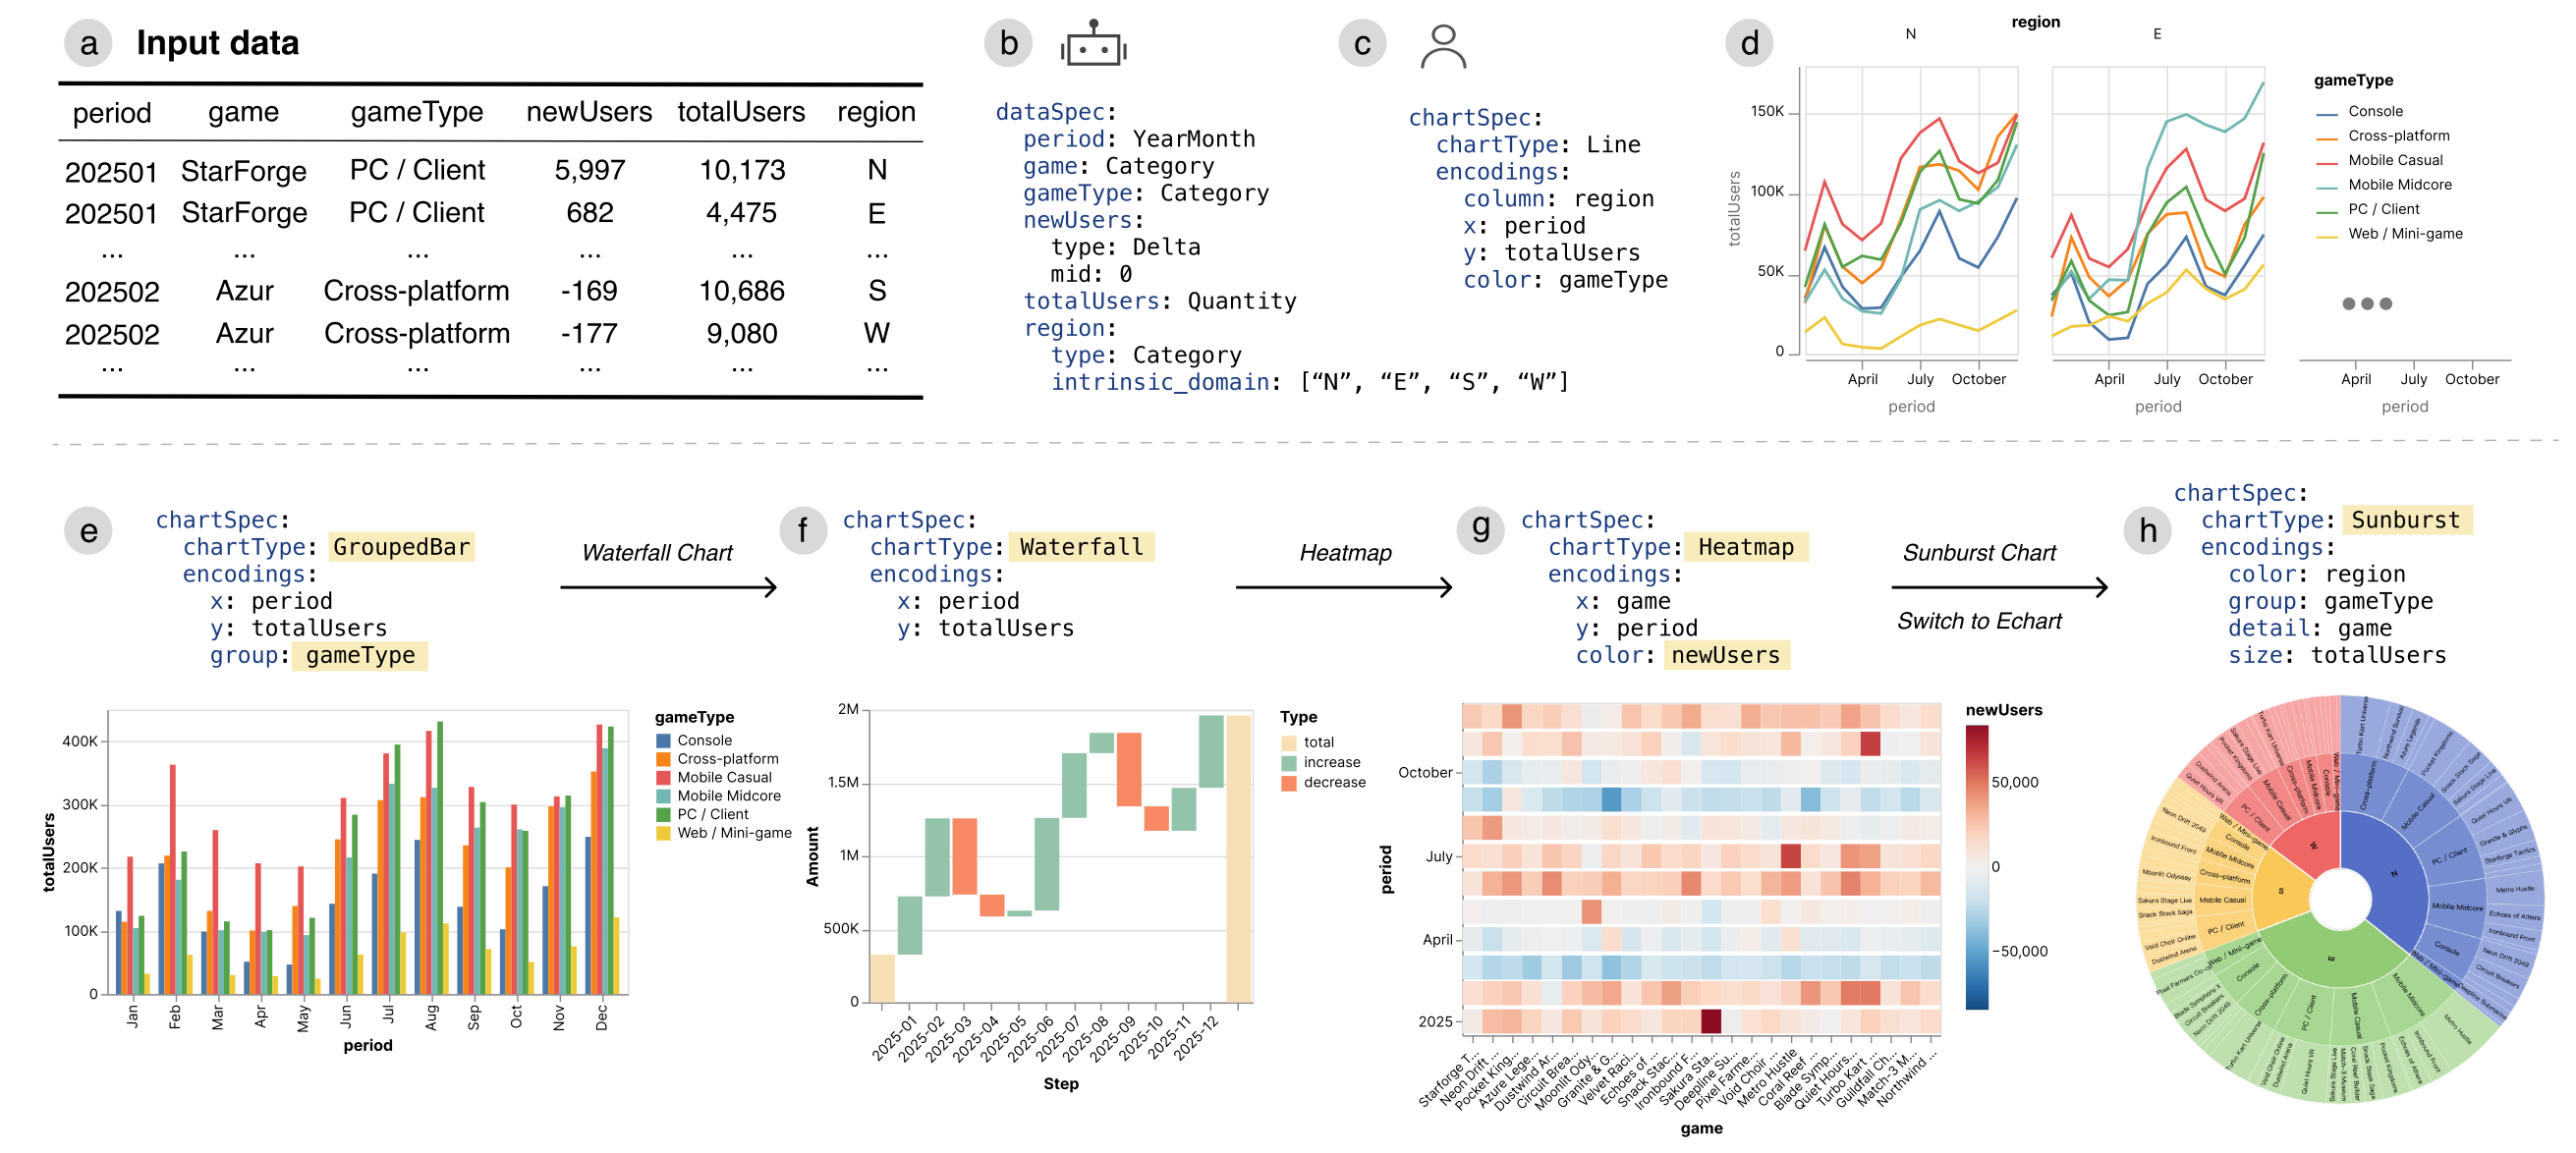
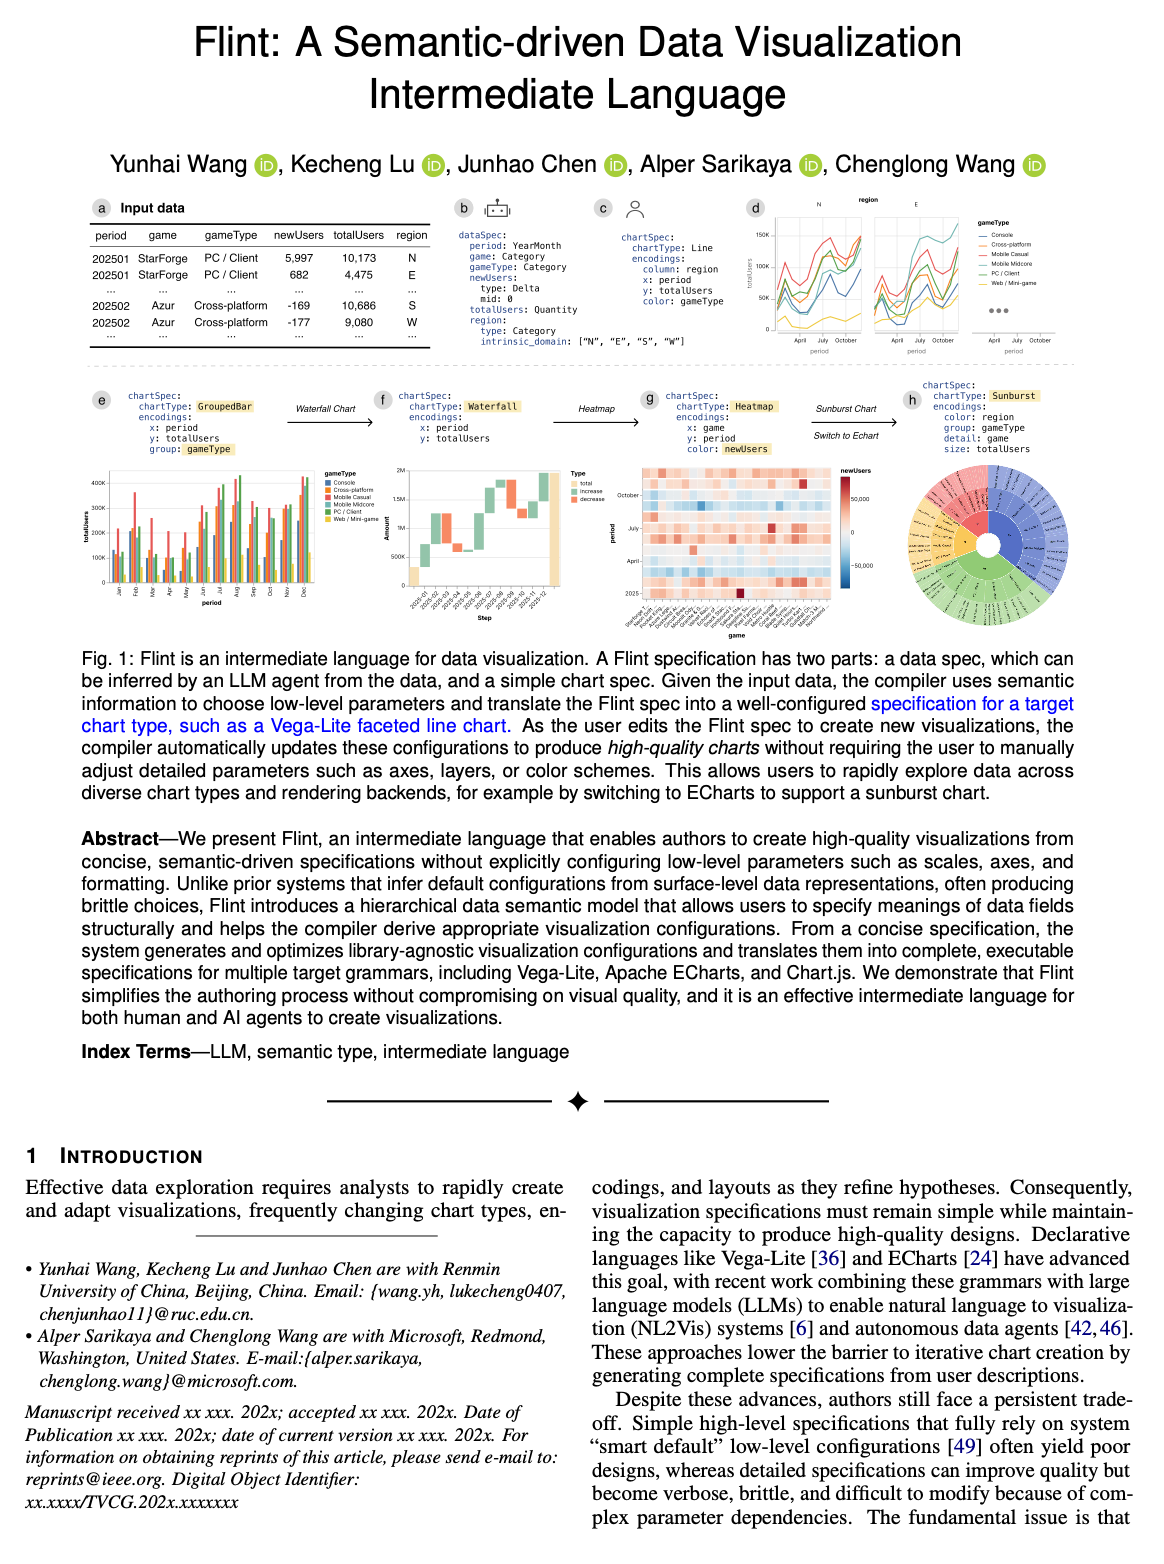
Figure 1:
Flint is an intermediate language for data visualization. A Flint specification has two parts: a data spec,
which can
be inferred by an LLM agent from the data, and a simple chart spec. Given the input data, the compiler uses
semantic
information to choose low-level parameters and translate the Flint spec into a well-configured specification
for a target
chart type, such as a Vega-Lite faceted line chart. As the user edits the Flint spec to create new
visualizations, the
compiler automatically updates these configurations to produce high-quality charts without requiring the
user to manually
adjust detailed parameters such as axes, layers, or color schemes. This allows users to rapidly explore data
across
diverse chart types and rendering backends, for example by switching to ECharts to support a sunburst chart.
Abstract:
We present Flint, an intermediate language that enables authors to create high-quality visualizations from concise, semantic-driven specifications without explicitly configuring low-level parameters such as scales, axes, and formatting. Unlike prior systems that infer default configurations from surface-level data representations, often producing brittle choices, Flint introduces a hierarchical data semantic model that allows users to specify meanings of data fields structurally and helps the compiler derive appropriate visualization configurations. From a concise specification, the system generates and optimizes library-agnostic visualization configurations and translates them into complete, executable specifications for multiple target grammars, including Vega-Lite, Apache ECharts, and Chart.js. We demonstrate that Flint simplifies the authoring process without compromising on visual quality, and it is an effective intermediate language for both human and AI agents to create visualizations.
Online Website: https://microsoft.github.io/flint-chart/
Source Code: https://github.com/microsoft/flint-chart
Figures:
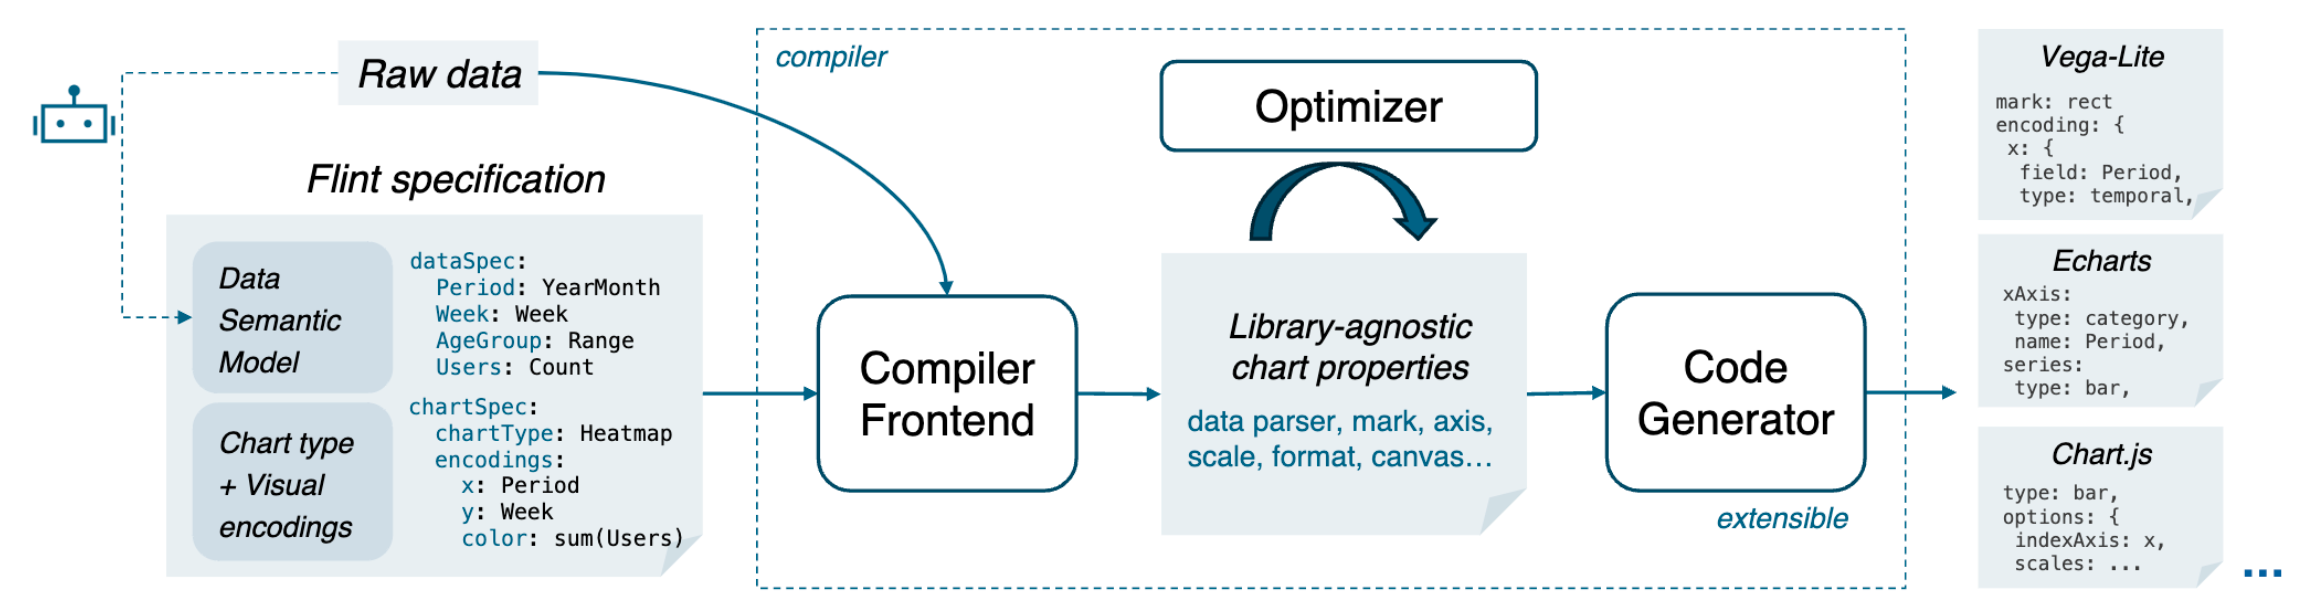
Figure 2: Overview of the Flint architecture. Flint employs a modular three-stage design: a compiler frontend for translating user intents into library agnostic properties, an optimization stage that refines configurations, and extensible code generators that produce library-native specs for desired rendering engines. LLM agents can infer data semantic specs from the raw data to reduce authoring efforts.
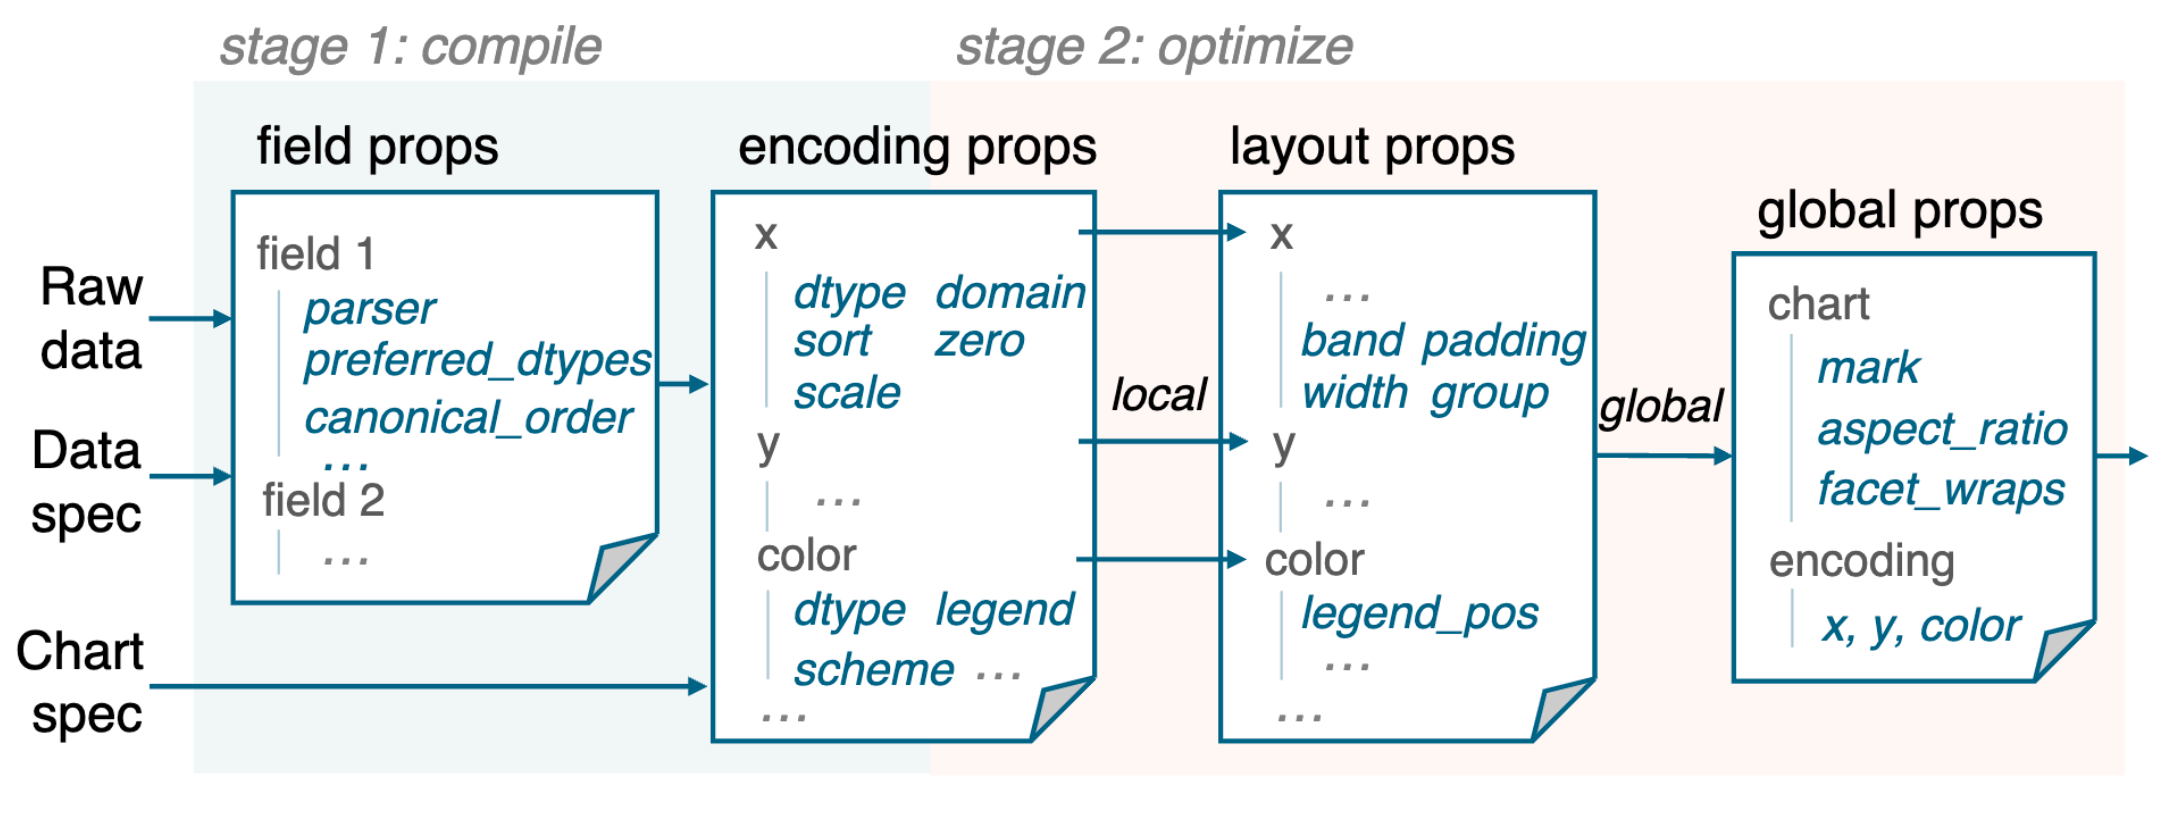
Figure 3: The compilation and optimization workflow. The system compiles raw inputs into intermediate field and encoding properties then optimizes local and global properties for refine chart sizing.
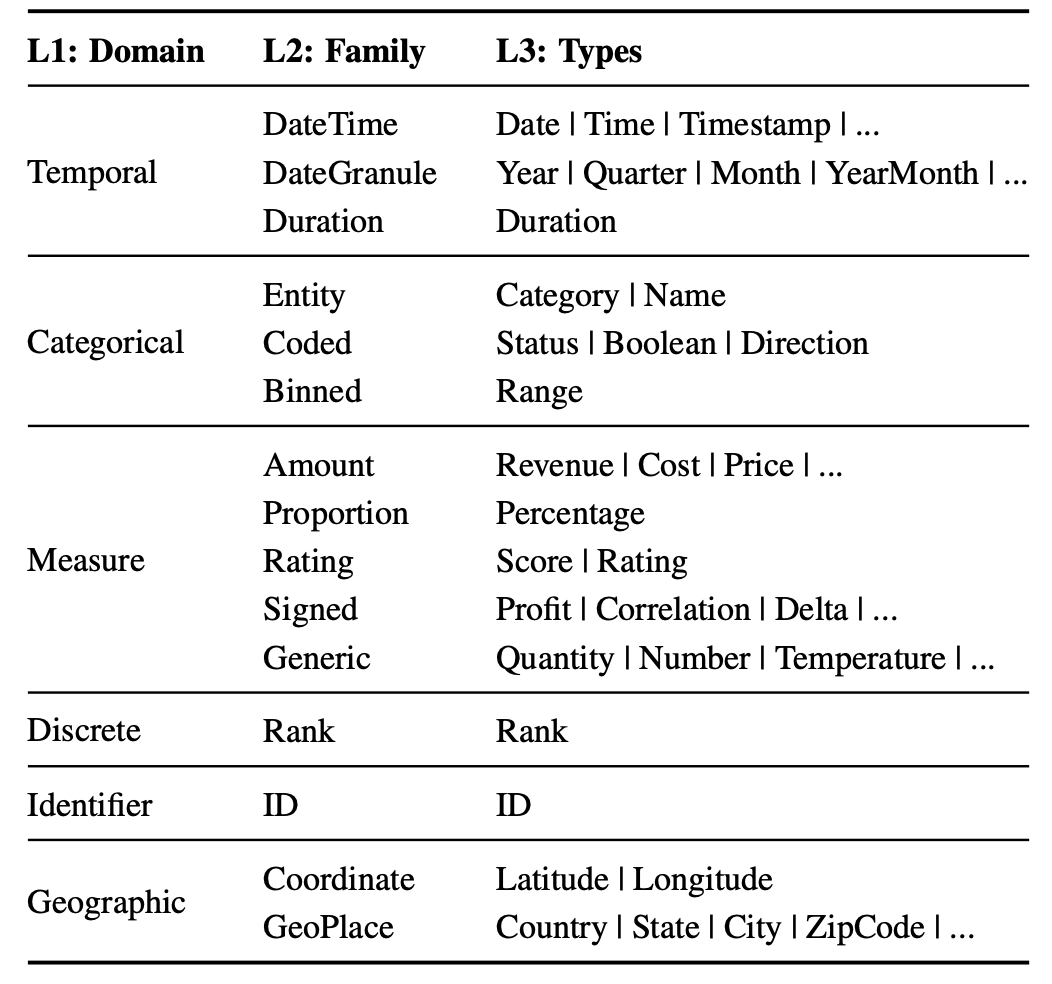
Table 1: Data semantics hierarchy examples.
Materials:
 |
| Paper (960k) |
Acknowledgements:
This work is supported by the grants of the NSFC (No.62502523, No.U2436209), the Beijing Natural Science
Foundation (L247027), the Fundamental Research Funds for the Central Universities, and the Research
Funds of Renmin University of China.