Image-Based Aspect Ratio Selection
IEEE Transactions on Visualization and Computer Graphics (Proc. InfoVis 2018), 2019
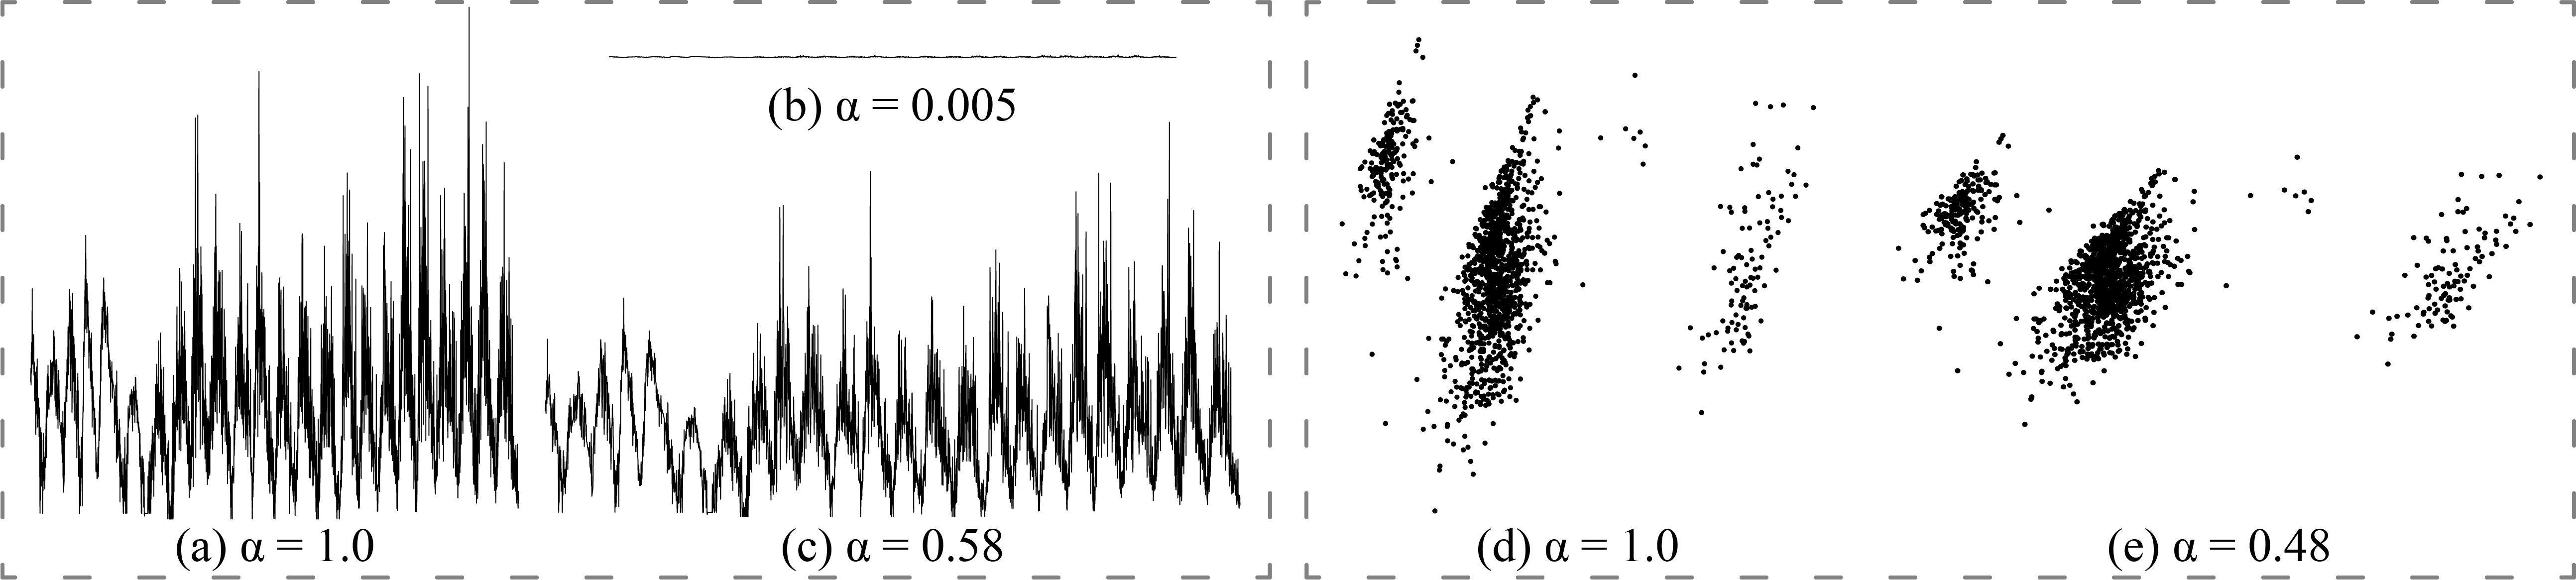
Figure 1: Influence of aspect ratio α on the perception of trends and cluster separability for the Sunspot dataset (a, b, c) and the Contraceptive Method Choice (CMC) dataset (d, e). (a) Line chart with the default aspect ratio, and (b) the aspect ratio selected by an existing method (RV), where both methods obscure the trends over the cycles. (c) The aspect ratio selected by our method (imgRV), where detailed cycle oscillations are revealed. (d) Scatter plot of three data clusters with the default aspect ratio, where the visual separation between the two clusters on the left is unclear. (e) The aspect ratio selected by our method shows clearer cluster structures.
Abstract:
There are several aspect ratio selection methods for function plots and line charts, but only few can handle general, discrete diagrams such as 2D scatter plots. However, these methods either lack a perceptual foundation or heavily rely on intermediate isoline representations, which depend on choosing the right isovalues and are time-consuming to compute. This paper introduces a general image-based approach for selecting aspect ratios for a wide variety of 2D diagrams, ranging from scatter plots and density function plots to line charts. Our approach is derived from Federer's co-area formula and a line integral representation that enable us to directly construct image-based versions of existing selection methods using density fields. In contrast to previous methods, our approach bypasses isoline computation, so it is faster to compute, while following the perceptual foundation to select aspect ratios. Furthermore, this approach is complemented by an anisotropic kernel density estimation to construct density fields, allowing us to more faithfully characterize data patterns, such as the subgroups in scatterplots or dense regions in time series. We demonstrate the effectiveness of our approach by quantitatively comparing to previous methods and revisiting a prior user study. Finally, we present extensions for ROI banking, multi-scale banking, and the application to image data.Materials:
Paper: [PDF 4.55M].
Supp: [PDF 13.6M].
Results:
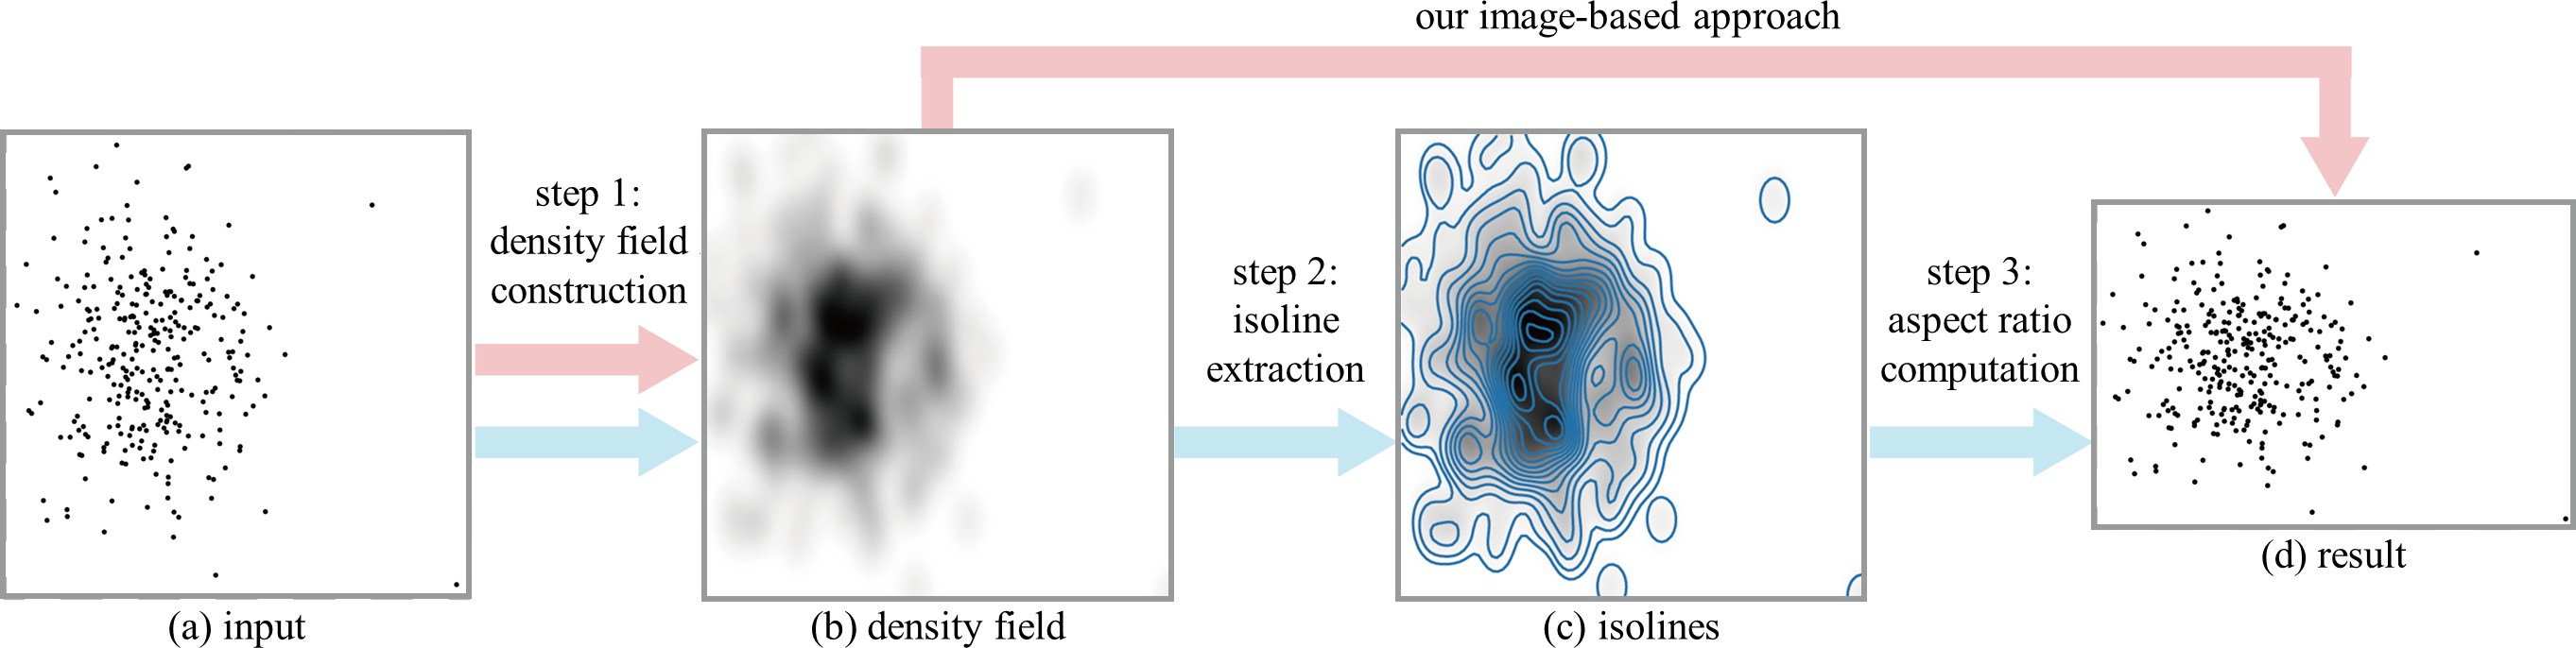
Figure 2: Comparative overview of the isoline-based (blue arrows) and our image-based approach (red arrows). Our method bypasses the construction of isolines and directly computes the aspect ratio from the density field. Step 1 is obsolete, if the input data is already given as a density field.
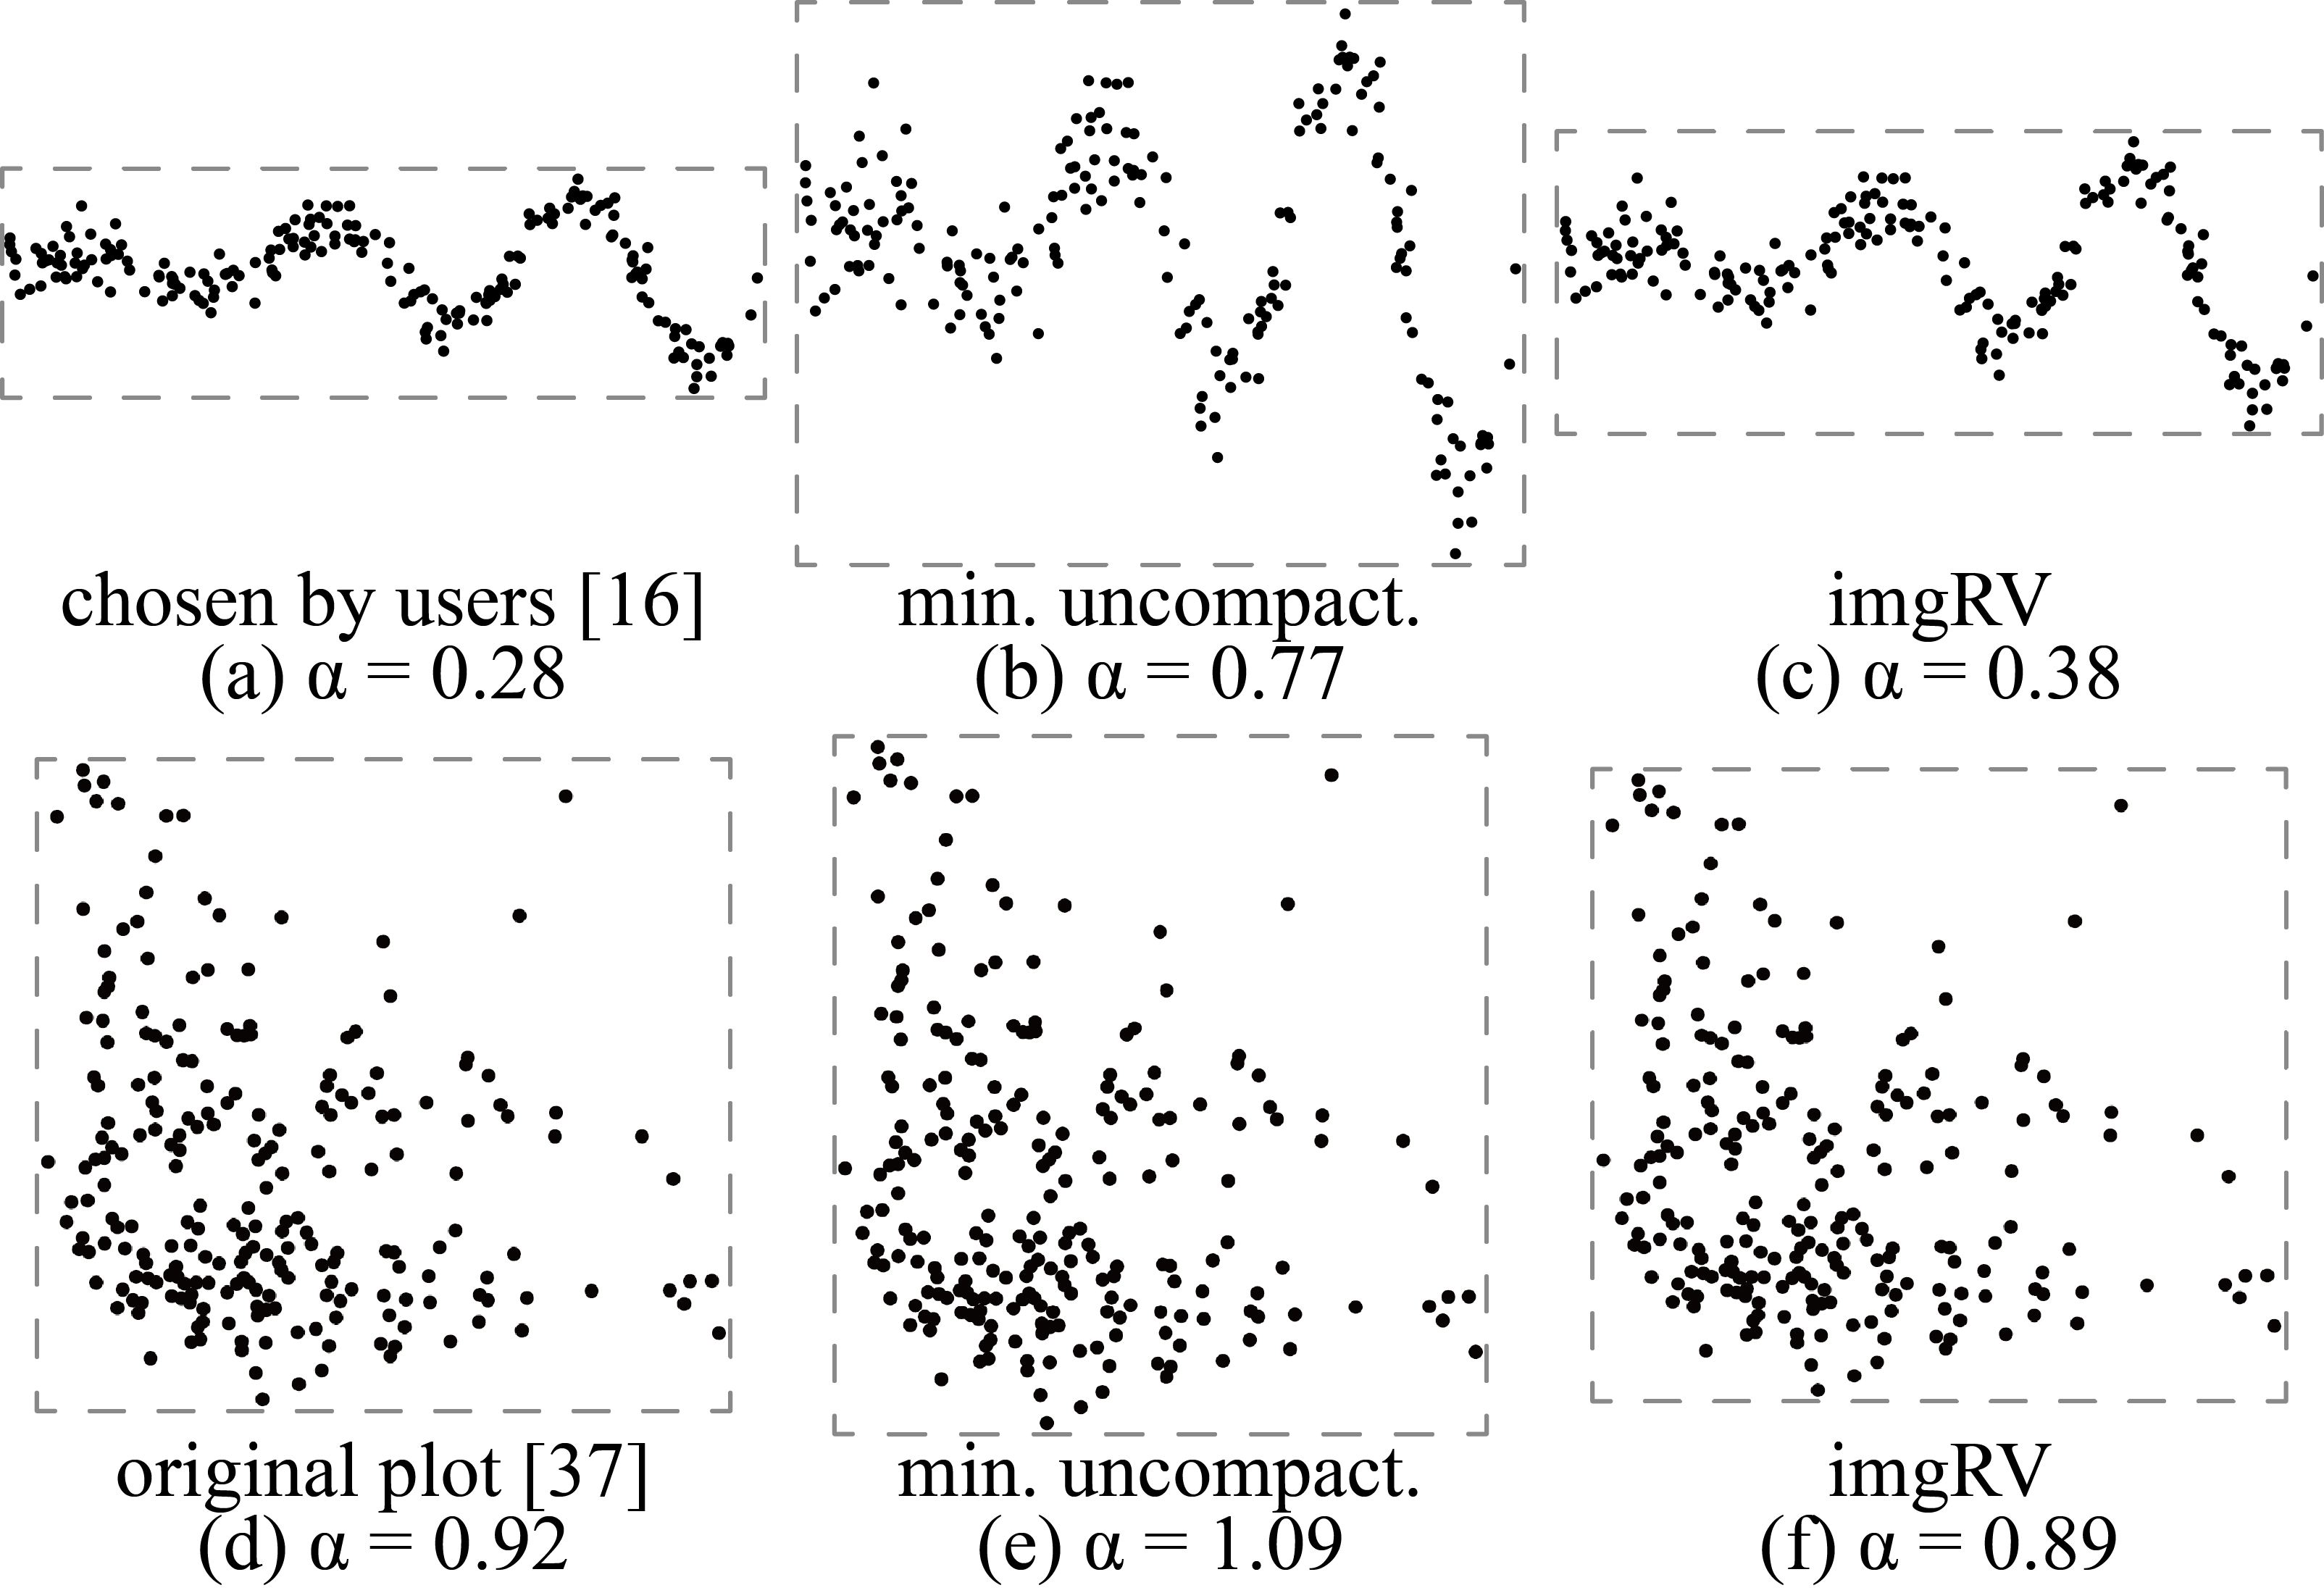
Figure 3: Comparing the aspect ratios selected by our method (c, f) and the method of Fink et al. [16] (b, e) to user preferences (a, d): function y = x sin x used in [16] (top) and a data plot extracted from [37] (bottom).
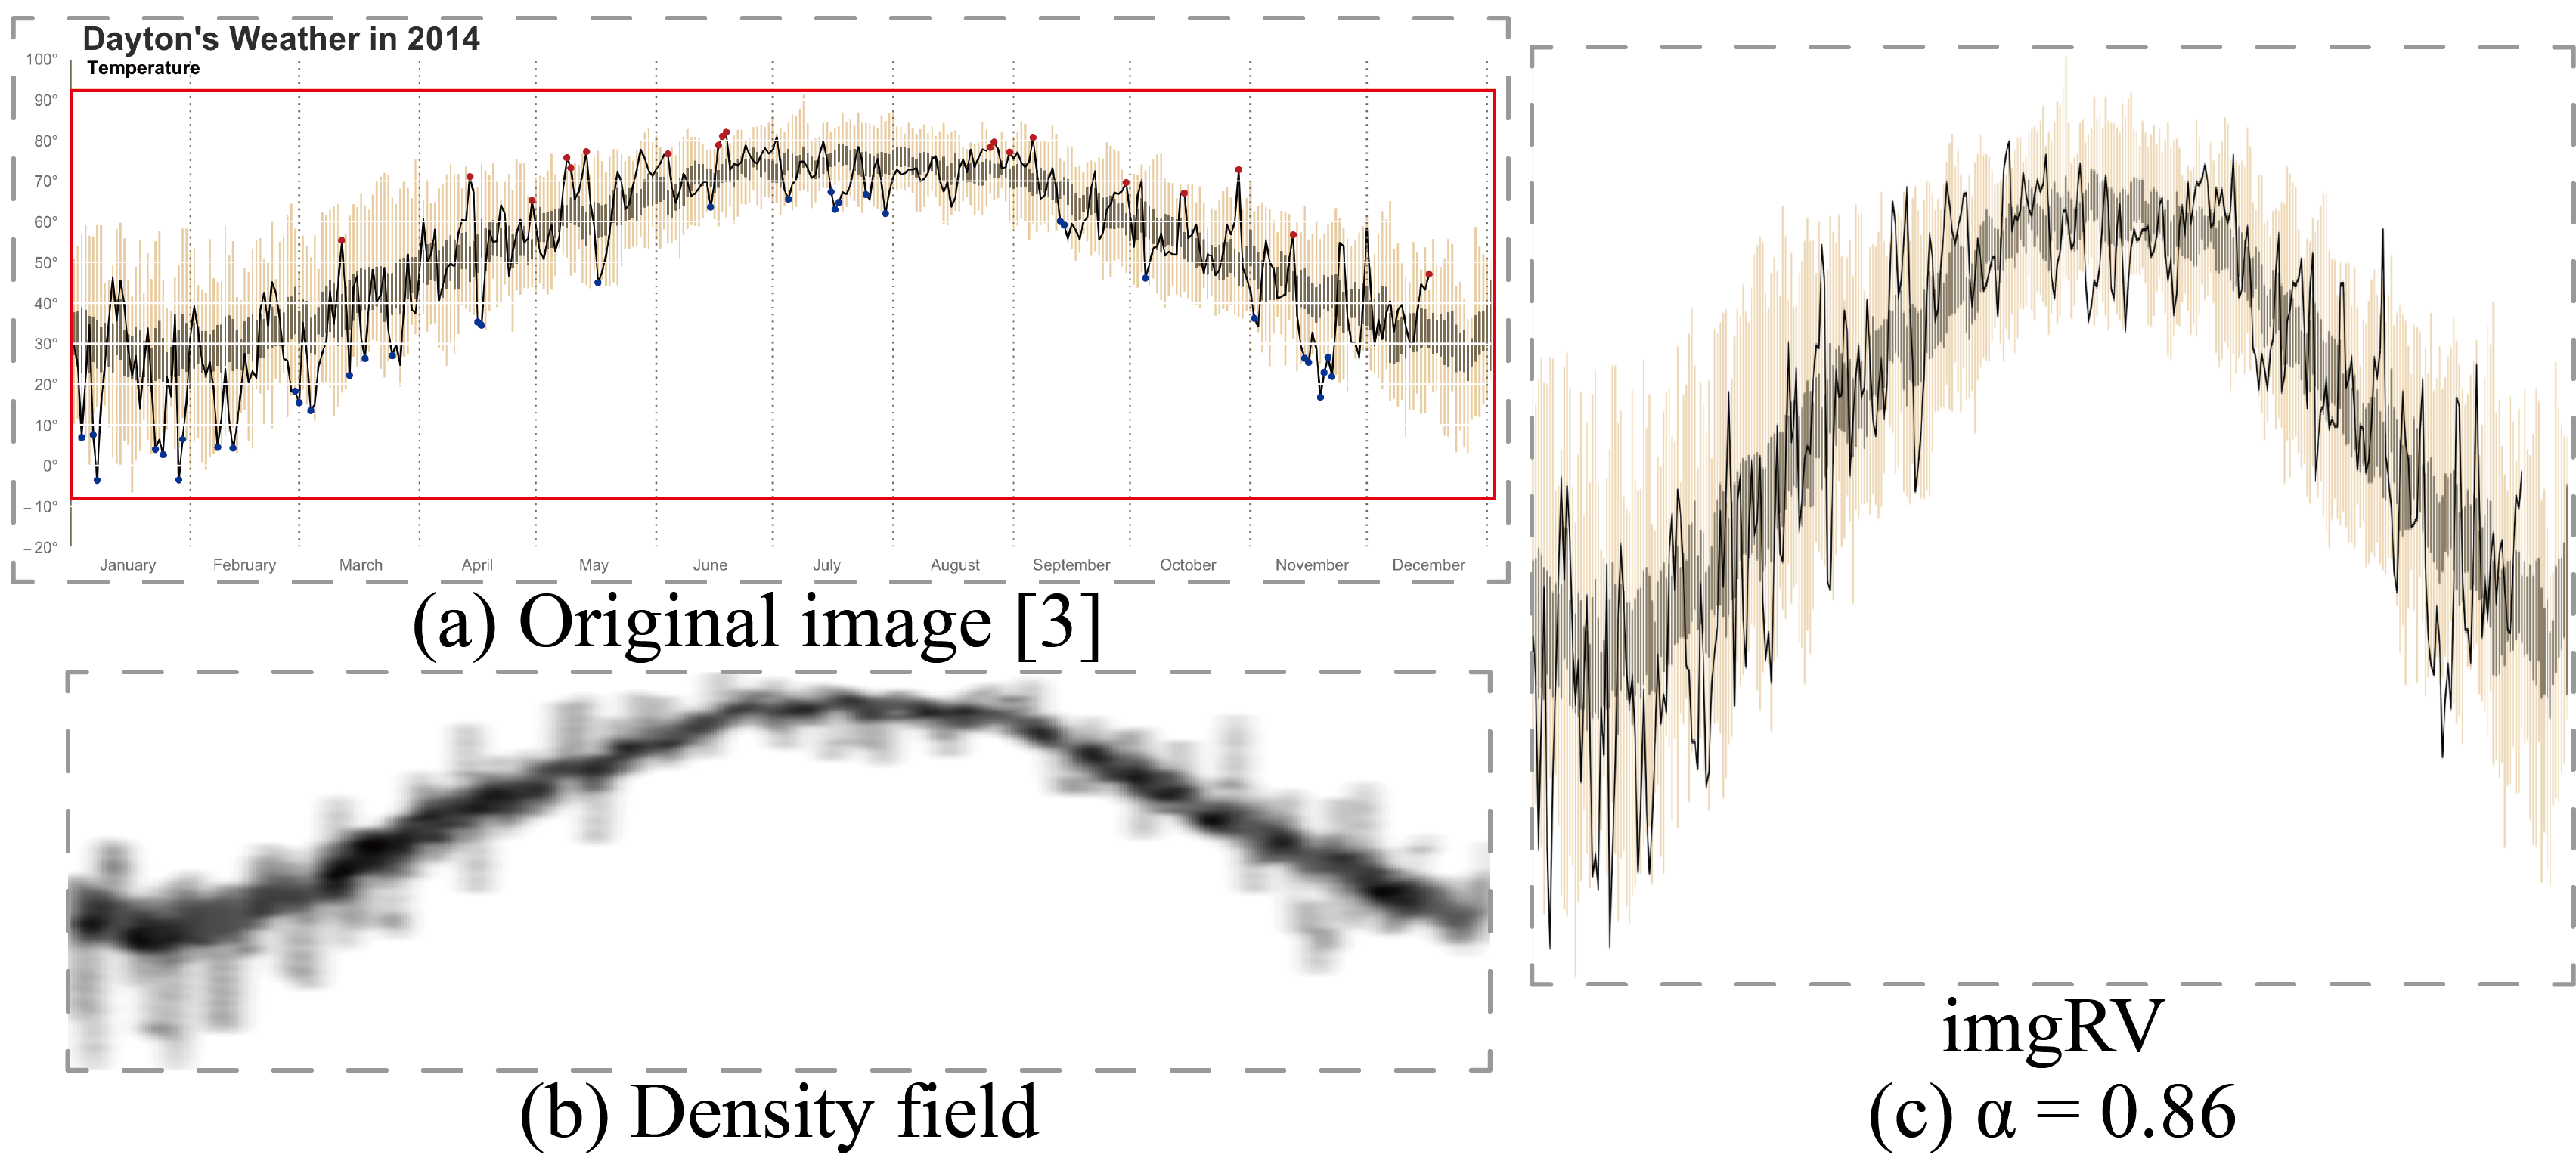
Figure 4: Selecting a good aspect ratio for an image from the Internet: (a) crop a relevant image part; (b) density field converted from the cropped image; and (c) result plotted with our selected aspect ratio.
Acknowledgements:
This work is supported by the grants of the National Key Research & Development Plan of China (2016YFB1001404), NSFC (61772315), NSFC-Guangdong Joint Fund (U1501255), Leading Talents of Guangdong Program (00201509), Shandong Provincial Natural Science Foundation (ZR2016FM12), the Open Research Fund of Beijing Key Laboratory of Big Data Technology for Food Safety, Beijing Technology and Business University, the Fundamental Research Funds of Shandong University, and the German Research Foundation (DFG) within projects A01/B01 of SFB/Transregio 161. We thank Marcel Hlawatsch for fruitful discussions.